
 Yahoo Finance
 Natural Gas NGAS USD/MMBtu - Headed for correction
A number of classic technical signals suggest that after an explosive start to the week, natural gas NGAS USD/MMBtu looks set for a correction.
Since the beginning of the week, the price of natural gas NGAS USD/MMBtu has soared from around 4.250 to today’s high just shy of 5.000 flat. Gains of such magnitude, even when supported by fundamentals (such as stormy weather in this instance) will normally precede a correction. Downside corrections occur after a big move as traders and investors sell their holdings and take profits. The magnitude and time frame of these corrections is often difficult to judge, but a number of technical indications on the natural gas daily chart suggest that the commodity’s pending correction could be a severe one.
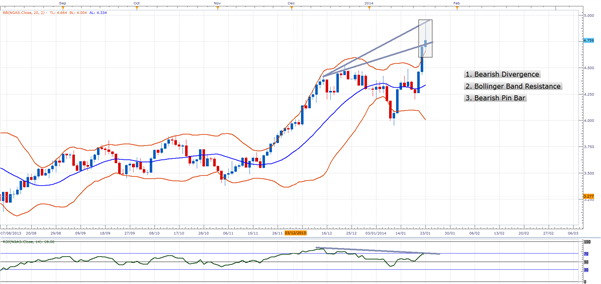
Natural Gas Daily Chart
Take a look at the chart above. The first immediate bearish sign is the bearish RSI divergence, highlighted on the chart by the grey trendlines. Regardless of which top you use (today’s high or yesterday’s close) the price of natural gas has made two higher-highs. Concurrent to these highs, the Relative Strength Index (RSI) indicator has made two lower-highs. The RSI indicator is a momentum indicator that can indicate points at which an asset might be overbought or oversold. Despite the week’s large move, RSI has not replicated price action and has failed to make new highs. This divergence is often a sign of a pending reversal.
The second bearish signal comes from the Bollinger Bands. Bollinger Bands use a combination of a moving average (the centerline) and two “bands” that represent standard deviation levels. When price hits an outer band, it will generally retrace back towards the central moving average. Currently, price has not just hit the upper band but has broken clean through it. Notice that on only a small number of occasions has price broken through an outer band in this way over the past two years, and on almost every occasion, it has spent no more than 1-2 days outside.
The third and final bearish signal formed as a result of today’s price action—a bearish pin bar. Bearish pin bars form when a trading session (in this case a day’s trading) opens and closes at a similar level. In between the open and close however, buyers force price upwards. These buyers then meet a wall of sellers, whose selling pressure subsequently drives price back down. The fact that the sellers have closed the session in control suggests they will likely remain in control for at least a portion of the next session (in this instance tomorrow).
If these three signals prove correct, a number of key levels will come into play. The first will be around 4.500. Not only is 4.500 a round number, making it psychologically relevant, but it has also offered strong resistance on two occasions—mid December and mid-January—in recent months. If price falls to this level, one of two things could happen.
The first, previous resistance could turn into support and act as a new price floor from which the uptrend can resume. If this happens, look initially to current price and then up towards 5.000 flat as potential targets.
Alternatively, price could break through this level. If so, a key level to watch will be 4.250, which (a few days earlier this month aside) acted as strong support throughout December/January. Beyond this, look to the 4.000 flat as potential support.
Importantly, the price action in natural gas this week has been extremely volatile. High volatility can present traders with opportunity, but can also expose them to a lot of risk. If you do decide to trade, a tight stop loss and strict money management is essential under these sorts of market conditions.
DailyFX provides forex news and technical analysis on the trends that influence the global currency markets.
Learn forex trading with a free practice account and trading charts from FXCM.
