
 Yahoo Finance
 Is ABM Industries Incorporated (NYSE:ABM) An Attractive Dividend Stock?

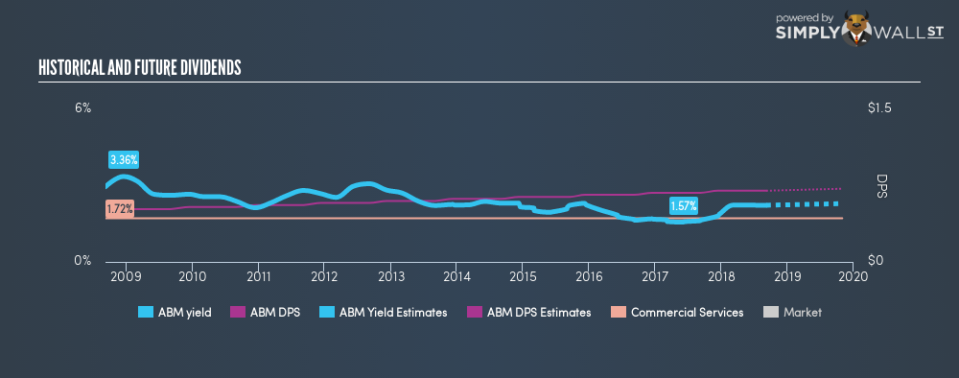
Dividends play a key role in compounding returns over time and can form a large part of our portfolio return. Historically, ABM Industries Incorporated (NYSE:ABM) has been paying a dividend to shareholders. Today it yields 2.2%. Does ABM Industries tick all the boxes of a great dividend stock? Below, I’ll take you through my analysis.
Check out our latest analysis for ABM Industries
5 questions I ask before picking a dividend stock
When researching a dividend stock, I always follow the following screening criteria:
Is its annual yield among the top 25% of dividend-paying companies?
Has its dividend been stable over the past (i.e. no missed payments or significant payout cuts)?
Has the amount of dividend per share grown over the past?
Can it afford to pay the current rate of dividends from its earnings?
Will it be able to continue to payout at the current rate in the future?
How well does ABM Industries fit our criteria?
ABM Industries has a trailing twelve-month payout ratio of 51.7%, meaning the dividend is sufficiently covered by earnings. Furthermore, analysts have not forecasted a dividends per share for the future, which makes it hard to determine the yield shareholders should expect, and whether the current payout is sustainable, moving forward.
Reliablity is an important factor for dividend stocks, particularly for income investors who want a strong track record of payment and a positive outlook for future payout. ABM has increased its DPS from $0.50 to $0.70 in the past 10 years. It has also been paying out dividend consistently during this time, as you’d expect for a company increasing its dividend levels. These are all positive signs of a great, reliable dividend stock.
Relative to peers, ABM Industries generates a yield of 2.2%, which is high for Commercial Services stocks but still below the market’s top dividend payers.
Next Steps:
Taking into account the dividend metrics, ABM Industries ticks most of the boxes as a strong dividend investment, putting it in my list of top dividend payers. Given that this is purely a dividend analysis, you should always research extensively before deciding whether or not a stock is an appropriate investment for you. I always recommend analysing the company’s fundamentals and underlying business before making an investment decision. I’ve put together three key aspects you should further research:
Future Outlook: What are well-informed industry analysts predicting for ABM’s future growth? Take a look at our free research report of analyst consensus for ABM’s outlook.
Valuation: What is ABM worth today? Even if the stock is a cash cow, it’s not worth an infinite price. The intrinsic value infographic in our free research report helps visualize whether ABM is currently mispriced by the market.
Other Dividend Rockstars: Are there better dividend payers with stronger fundamentals out there? Check out our free list of these great stocks here.
To help readers see past the short term volatility of the financial market, we aim to bring you a long-term focused research analysis purely driven by fundamental data. Note that our analysis does not factor in the latest price-sensitive company announcements.
The author is an independent contributor and at the time of publication had no position in the stocks mentioned. For errors that warrant correction please contact the editor at editorial-team@simplywallst.com.
