
 Yahoo Finance
 Advanced Micro Devices' (NASDAQ:AMD) five-year earnings growth trails the 54% YoY shareholder returns
We think all investors should try to buy and hold high quality multi-year winners. While not every stock performs well, when investors win, they can win big. Don't believe it? Then look at the Advanced Micro Devices, Inc. (NASDAQ:AMD) share price. It's 777% higher than it was five years ago. This just goes to show the value creation that some businesses can achieve. It's also good to see the share price up 54% over the last quarter. This could be related to the recent financial results, released recently - you can catch up on the most recent data by reading our company report. Anyone who held for that rewarding ride would probably be keen to talk about it.
Since it's been a strong week for Advanced Micro Devices shareholders, let's have a look at trend of the longer term fundamentals.
See our latest analysis for Advanced Micro Devices
While markets are a powerful pricing mechanism, share prices reflect investor sentiment, not just underlying business performance. By comparing earnings per share (EPS) and share price changes over time, we can get a feel for how investor attitudes to a company have morphed over time.
During five years of share price growth, Advanced Micro Devices achieved compound earnings per share (EPS) growth of 24% per year. This EPS growth is slower than the share price growth of 54% per year, over the same period. This suggests that market participants hold the company in higher regard, these days. That's not necessarily surprising considering the five-year track record of earnings growth. This favorable sentiment is reflected in its (fairly optimistic) P/E ratio of 490.65.
The company's earnings per share (over time) is depicted in the image below (click to see the exact numbers).
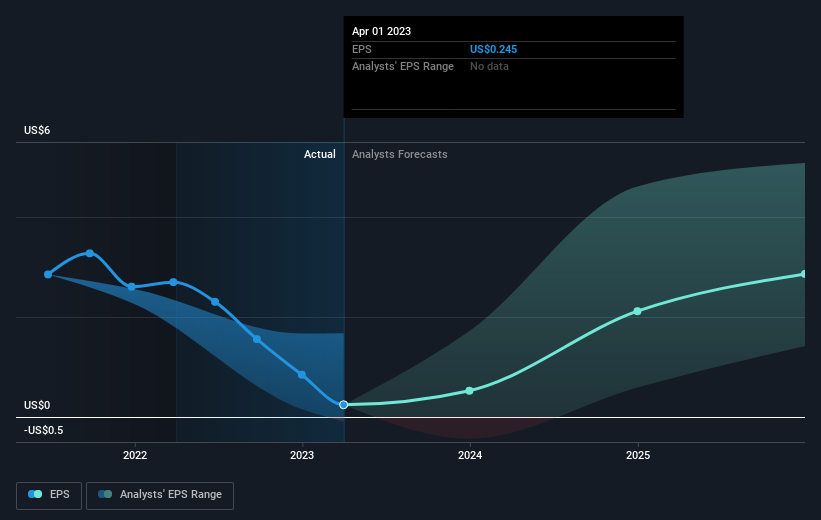
Before buying or selling a stock, we always recommend a close examination of historic growth trends, available here.
A Different Perspective
We're pleased to report that Advanced Micro Devices shareholders have received a total shareholder return of 22% over one year. However, the TSR over five years, coming in at 54% per year, is even more impressive. Potential buyers might understandably feel they've missed the opportunity, but it's always possible business is still firing on all cylinders. It's always interesting to track share price performance over the longer term. But to understand Advanced Micro Devices better, we need to consider many other factors. Take risks, for example - Advanced Micro Devices has 2 warning signs we think you should be aware of.
If you like to buy stocks alongside management, then you might just love this free list of companies. (Hint: insiders have been buying them).
Please note, the market returns quoted in this article reflect the market weighted average returns of stocks that currently trade on American exchanges.
Have feedback on this article? Concerned about the content? Get in touch with us directly. Alternatively, email editorial-team (at) simplywallst.com.
This article by Simply Wall St is general in nature. We provide commentary based on historical data and analyst forecasts only using an unbiased methodology and our articles are not intended to be financial advice. It does not constitute a recommendation to buy or sell any stock, and does not take account of your objectives, or your financial situation. We aim to bring you long-term focused analysis driven by fundamental data. Note that our analysis may not factor in the latest price-sensitive company announcements or qualitative material. Simply Wall St has no position in any stocks mentioned.
Join A Paid User Research Session
You’ll receive a US$30 Amazon Gift card for 1 hour of your time while helping us build better investing tools for the individual investors like yourself. Sign up here
