
 Yahoo Finance
 Alibaba Group Holding (NYSE:BABA) investors are sitting on a loss of 58% if they invested a year ago
Even the best stock pickers will make plenty of bad investments. Anyone who held Alibaba Group Holding Limited (NYSE:BABA) over the last year knows what a loser feels like. The share price is down a hefty 58% in that time. Even if you look out three years, the returns are still disappointing, with the share price down48% in that time. The falls have accelerated recently, with the share price down 28% in the last three months. Of course, this share price action may well have been influenced by the 11% decline in the broader market, throughout the period.
So let's have a look and see if the longer term performance of the company has been in line with the underlying business' progress.
View our latest analysis for Alibaba Group Holding
There is no denying that markets are sometimes efficient, but prices do not always reflect underlying business performance. One flawed but reasonable way to assess how sentiment around a company has changed is to compare the earnings per share (EPS) with the share price.
Unfortunately Alibaba Group Holding reported an EPS drop of 59% for the last year. This change in EPS is remarkably close to the 58% decrease in the share price. Therefore one could posit that the market has not become more concerned about the company, despite the lower EPS. Rather, the share price is remains a similar multiple of the EPS, suggesting the outlook remains the same.
The graphic below depicts how EPS has changed over time (unveil the exact values by clicking on the image).
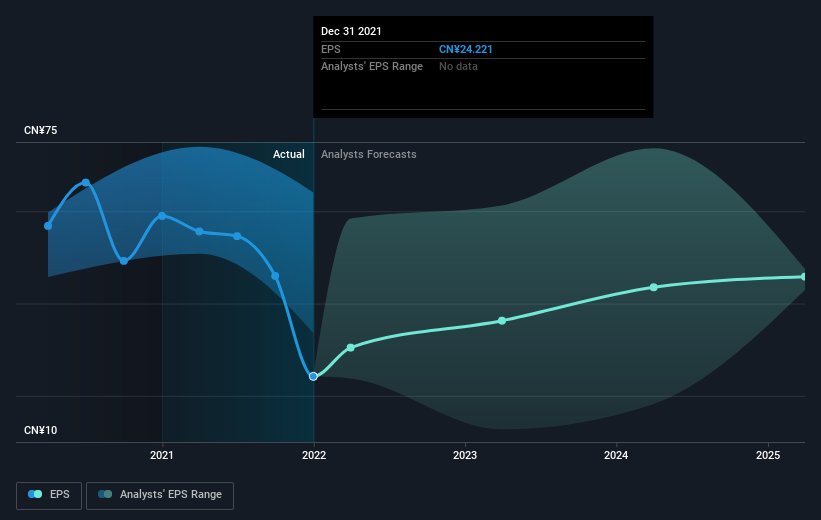
This free interactive report on Alibaba Group Holding's earnings, revenue and cash flow is a great place to start, if you want to investigate the stock further.
A Different Perspective
We regret to report that Alibaba Group Holding shareholders are down 58% for the year. Unfortunately, that's worse than the broader market decline of 9.0%. Having said that, it's inevitable that some stocks will be oversold in a falling market. The key is to keep your eyes on the fundamental developments. Regrettably, last year's performance caps off a bad run, with the shareholders facing a total loss of 5% per year over five years. Generally speaking long term share price weakness can be a bad sign, though contrarian investors might want to research the stock in hope of a turnaround. I find it very interesting to look at share price over the long term as a proxy for business performance. But to truly gain insight, we need to consider other information, too. Even so, be aware that Alibaba Group Holding is showing 3 warning signs in our investment analysis , you should know about...
Of course Alibaba Group Holding may not be the best stock to buy. So you may wish to see this free collection of growth stocks.
Please note, the market returns quoted in this article reflect the market weighted average returns of stocks that currently trade on US exchanges.
Have feedback on this article? Concerned about the content? Get in touch with us directly. Alternatively, email editorial-team (at) simplywallst.com.
This article by Simply Wall St is general in nature. We provide commentary based on historical data and analyst forecasts only using an unbiased methodology and our articles are not intended to be financial advice. It does not constitute a recommendation to buy or sell any stock, and does not take account of your objectives, or your financial situation. We aim to bring you long-term focused analysis driven by fundamental data. Note that our analysis may not factor in the latest price-sensitive company announcements or qualitative material. Simply Wall St has no position in any stocks mentioned.
