
 Yahoo Finance
 Alpha Financial Markets Consulting (LON:AFM) Might Have The Makings Of A Multi-Bagger
If you're looking for a multi-bagger, there's a few things to keep an eye out for. Ideally, a business will show two trends; firstly a growing return on capital employed (ROCE) and secondly, an increasing amount of capital employed. Put simply, these types of businesses are compounding machines, meaning they are continually reinvesting their earnings at ever-higher rates of return. Speaking of which, we noticed some great changes in Alpha Financial Markets Consulting's (LON:AFM) returns on capital, so let's have a look.
Return On Capital Employed (ROCE): What Is It?
For those who don't know, ROCE is a measure of a company's yearly pre-tax profit (its return), relative to the capital employed in the business. To calculate this metric for Alpha Financial Markets Consulting, this is the formula:
Return on Capital Employed = Earnings Before Interest and Tax (EBIT) ÷ (Total Assets - Current Liabilities)
0.12 = UK£20m ÷ (UK£229m - UK£66m) (Based on the trailing twelve months to March 2022).
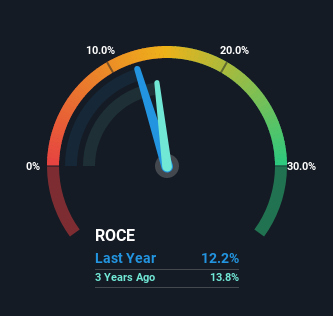
Thus, Alpha Financial Markets Consulting has an ROCE of 12%. In absolute terms, that's a pretty normal return, and it's somewhat close to the Professional Services industry average of 15%.
Check out our latest analysis for Alpha Financial Markets Consulting
In the above chart we have measured Alpha Financial Markets Consulting's prior ROCE against its prior performance, but the future is arguably more important. If you're interested, you can view the analysts predictions in our free report on analyst forecasts for the company.
What Can We Tell From Alpha Financial Markets Consulting's ROCE Trend?
Investors would be pleased with what's happening at Alpha Financial Markets Consulting. Over the last five years, returns on capital employed have risen substantially to 12%. Basically the business is earning more per dollar of capital invested and in addition to that, 92% more capital is being employed now too. So we're very much inspired by what we're seeing at Alpha Financial Markets Consulting thanks to its ability to profitably reinvest capital.
On a side note, we noticed that the improvement in ROCE appears to be partly fueled by an increase in current liabilities. Effectively this means that suppliers or short-term creditors are now funding 29% of the business, which is more than it was five years ago. It's worth keeping an eye on this because as the percentage of current liabilities to total assets increases, some aspects of risk also increase.
What We Can Learn From Alpha Financial Markets Consulting's ROCE
In summary, it's great to see that Alpha Financial Markets Consulting can compound returns by consistently reinvesting capital at increasing rates of return, because these are some of the key ingredients of those highly sought after multi-baggers. And with the stock having performed exceptionally well over the last three years, these patterns are being accounted for by investors. In light of that, we think it's worth looking further into this stock because if Alpha Financial Markets Consulting can keep these trends up, it could have a bright future ahead.
If you want to continue researching Alpha Financial Markets Consulting, you might be interested to know about the 2 warning signs that our analysis has discovered.
For those who like to invest in solid companies, check out this free list of companies with solid balance sheets and high returns on equity.
Have feedback on this article? Concerned about the content? Get in touch with us directly. Alternatively, email editorial-team (at) simplywallst.com.
This article by Simply Wall St is general in nature. We provide commentary based on historical data and analyst forecasts only using an unbiased methodology and our articles are not intended to be financial advice. It does not constitute a recommendation to buy or sell any stock, and does not take account of your objectives, or your financial situation. We aim to bring you long-term focused analysis driven by fundamental data. Note that our analysis may not factor in the latest price-sensitive company announcements or qualitative material. Simply Wall St has no position in any stocks mentioned.
Join A Paid User Research Session
You’ll receive a US$30 Amazon Gift card for 1 hour of your time while helping us build better investing tools for the individual investors like yourself. Sign up here
