
 Yahoo Finance
 Amidst increasing losses, Investors bid up VerticalScope Holdings (TSE:FORA) 23% this past week
VerticalScope Holdings Inc. (TSE:FORA) shareholders should be happy to see the share price up 23% in the last week. But that doesn't change the fact that the returns over the last year have been stomach churning. During that time the share price has plummeted like a stone, down 79%. So it's not that amazing to see a bit of a bounce. The real question is whether the company can turn around its fortunes.
The recent uptick of 23% could be a positive sign of things to come, so let's take a look at historical fundamentals.
View our latest analysis for VerticalScope Holdings
VerticalScope Holdings wasn't profitable in the last twelve months, it is unlikely we'll see a strong correlation between its share price and its earnings per share (EPS). Arguably revenue is our next best option. Generally speaking, companies without profits are expected to grow revenue every year, and at a good clip. That's because it's hard to be confident a company will be sustainable if revenue growth is negligible, and it never makes a profit.
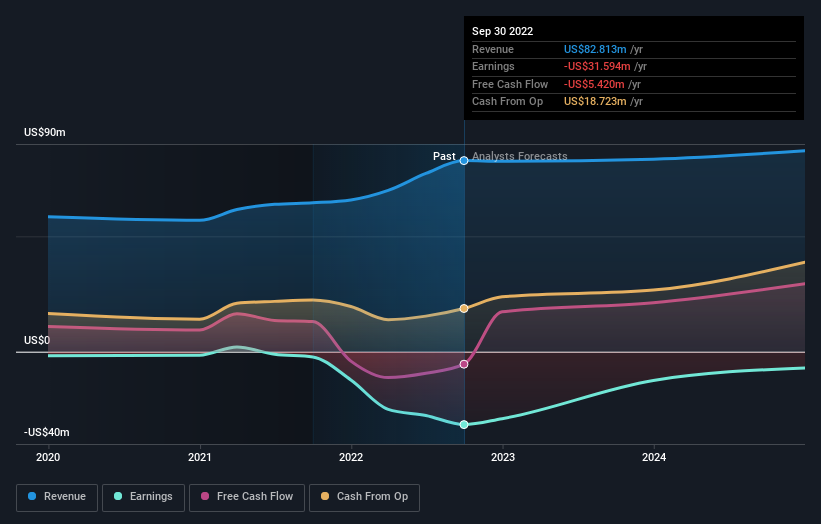
In the last twelve months, VerticalScope Holdings increased its revenue by 28%. We think that is pretty nice growth. However, it seems like the market wanted more, since the share price is down 79%. One fear might be that the company might be losing too much money and will need to raise more. It seems that the market has concerns about the future, because that share price action does not seem to reflect the revenue growth at all.
The image below shows how earnings and revenue have tracked over time (if you click on the image you can see greater detail).
It's probably worth noting we've seen significant insider buying in the last quarter, which we consider a positive. On the other hand, we think the revenue and earnings trends are much more meaningful measures of the business. If you are thinking of buying or selling VerticalScope Holdings stock, you should check out this free report showing analyst profit forecasts.
A Different Perspective
We doubt VerticalScope Holdings shareholders are happy with the loss of 79% over twelve months. That falls short of the market, which lost 3.8%. There's no doubt that's a disappointment, but the stock may well have fared better in a stronger market. The share price decline has continued throughout the most recent three months, down 33%, suggesting an absence of enthusiasm from investors. Given the relatively short history of this stock, we'd remain pretty wary until we see some strong business performance. It's always interesting to track share price performance over the longer term. But to understand VerticalScope Holdings better, we need to consider many other factors. For instance, we've identified 2 warning signs for VerticalScope Holdings that you should be aware of.
There are plenty of other companies that have insiders buying up shares. You probably do not want to miss this free list of growing companies that insiders are buying.
Please note, the market returns quoted in this article reflect the market weighted average returns of stocks that currently trade on CA exchanges.
Have feedback on this article? Concerned about the content? Get in touch with us directly. Alternatively, email editorial-team (at) simplywallst.com.
This article by Simply Wall St is general in nature. We provide commentary based on historical data and analyst forecasts only using an unbiased methodology and our articles are not intended to be financial advice. It does not constitute a recommendation to buy or sell any stock, and does not take account of your objectives, or your financial situation. We aim to bring you long-term focused analysis driven by fundamental data. Note that our analysis may not factor in the latest price-sensitive company announcements or qualitative material. Simply Wall St has no position in any stocks mentioned.
Join A Paid User Research Session
You’ll receive a US$30 Amazon Gift card for 1 hour of your time while helping us build better investing tools for the individual investors like yourself. Sign up here
