
 Yahoo Finance
 Is Amigo Holdings PLC (LON:AMGO) Attractive At This PE Ratio?

I am writing today to help inform people who are new to the stock market and want to start learning about core concepts of fundamental analysis on practical examples from today’s market.
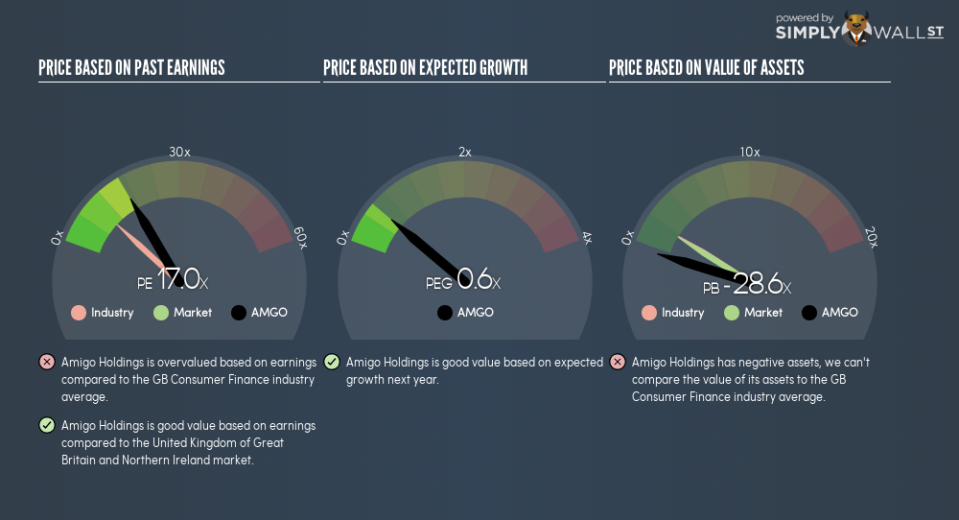
Amigo Holdings PLC (LON:AMGO) trades with a trailing P/E of 17, which is higher than the industry average of 9.8. While this might not seem positive, it is important to understand the assumptions behind the P/E ratio before you make any investment decisions. In this article, I will break down what the P/E ratio is, how to interpret it and what to watch out for.
See our latest analysis for Amigo Holdings
Demystifying the P/E ratio
P/E is a popular ratio used for relative valuation. It compares a stock’s price per share to the stock’s earnings per share. A more intuitive way of understanding the P/E ratio is to think of it as how much investors are paying for each dollar of the company’s earnings.
P/E Calculation for AMGO
Price-Earnings Ratio = Price per share ÷ Earnings per share
AMGO Price-Earnings Ratio = £2.17 ÷ £0.128 = 17x
The P/E ratio isn’t a metric you view in isolation and only becomes useful when you compare it against other similar companies. We want to compare the stock’s P/E ratio to the average of companies that have similar characteristics as AMGO, such as size and country of operation. A common peer group is companies that exist in the same industry, which is what I use. AMGO’s P/E of 17 is higher than its industry peers (9.8), which implies that each dollar of AMGO’s earnings is being overvalued by investors. This multiple is a median of profitable companies of 10 Consumer Finance companies in GB including ASA International Group, Manx Financial Group and Arrow Global Group. You could think of it like this: the market is pricing AMGO as if it is a stronger company than the average of its industry group.
Assumptions to be aware of
Before you jump to conclusions it is important to realise that there are assumptions in this analysis. The first is that our “similar companies” are actually similar to AMGO. If not, the difference in P/E might be a result of other factors. For example, if Amigo Holdings PLC is growing faster than its peers, then it would deserve a higher P/E ratio. We should also be aware that the stocks we are comparing to AMGO may not be fairly valued. Thus while we might conclude that it is richly valued relative to its peers, that could be explained by the peer group being undervalued.
What this means for you:
If your personal research into the stock confirms what the P/E ratio is telling you, it might be a good time to rebalance your portfolio and reduce your holdings in AMGO. But keep in mind that the usefulness of relative valuation depends on whether you are comfortable with making the assumptions I mentioned above. Remember that basing your investment decision off one metric alone is certainly not sufficient. There are many things I have not taken into account in this article and the PE ratio is very one-dimensional. If you have not done so already, I highly recommend you to complete your research by taking a look at the following:
Future Outlook: What are well-informed industry analysts predicting for AMGO’s future growth? Take a look at our free research report of analyst consensus for AMGO’s outlook.
Financial Health: Are AMGO’s operations financially sustainable? Balance sheets can be hard to analyze, which is why we’ve done it for you. Check out our financial health checks here.
Other High-Performing Stocks: Are there other stocks that provide better prospects with proven track records? Explore our free list of these great stocks here.
To help readers see past the short term volatility of the financial market, we aim to bring you a long-term focused research analysis purely driven by fundamental data. Note that our analysis does not factor in the latest price-sensitive company announcements.
The author is an independent contributor and at the time of publication had no position in the stocks mentioned. For errors that warrant correction please contact the editor at editorial-team@simplywallst.com.
