
 Yahoo Finance
 ams-OSRAM (VTX:AMS) adds CHF98m to market cap in the past 7 days, though investors from five years ago are still down 85%
It is a pleasure to report that the ams-OSRAM AG (VTX:AMS) is up 60% in the last quarter. But spare a thought for the long term holders, who have held the stock as it bled value over the last five years. In fact, the share price has tumbled down a mountain to land 90% lower after that period. While the recent increase might be a green shoot, we're certainly hesitant to rejoice. The important question is if the business itself justifies a higher share price in the long term. We really hope anyone holding through that price crash has a diversified portfolio. Even when you lose money, you don't have to lose the lesson.
The recent uptick of 4.3% could be a positive sign of things to come, so let's take a look at historical fundamentals.
Check out our latest analysis for ams-OSRAM
Given that ams-OSRAM didn't make a profit in the last twelve months, we'll focus on revenue growth to form a quick view of its business development. Generally speaking, companies without profits are expected to grow revenue every year, and at a good clip. That's because it's hard to be confident a company will be sustainable if revenue growth is negligible, and it never makes a profit.
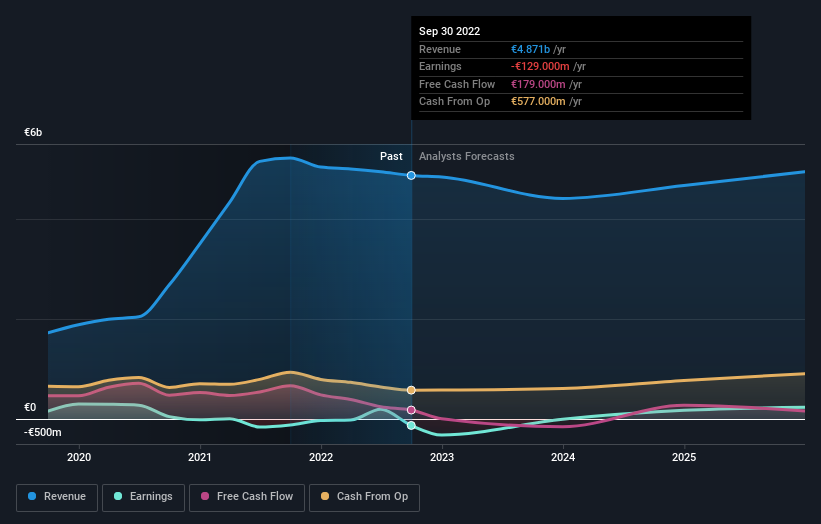
In the last half decade, ams-OSRAM saw its revenue increase by 36% per year. That's well above most other pre-profit companies. So on the face of it we're really surprised to see the share price has averaged a fall of 14% each year, in the same time period. You'd have to assume the market is worried that profits won't come soon enough. We'd recommend carefully checking for indications of future growth - and balance sheet threats - before considering a purchase.
The company's revenue and earnings (over time) are depicted in the image below (click to see the exact numbers).
ams-OSRAM is a well known stock, with plenty of analyst coverage, suggesting some visibility into future growth. Given we have quite a good number of analyst forecasts, it might be well worth checking out this free chart depicting consensus estimates.
What About The Total Shareholder Return (TSR)?
Investors should note that there's a difference between ams-OSRAM's total shareholder return (TSR) and its share price change, which we've covered above. Arguably the TSR is a more complete return calculation because it accounts for the value of dividends (as if they were reinvested), along with the hypothetical value of any discounted capital that have been offered to shareholders. Its history of dividend payouts mean that ams-OSRAM's TSR, which was a 85% drop over the last 5 years, was not as bad as the share price return.
A Different Perspective
While the broader market lost about 6.0% in the twelve months, ams-OSRAM shareholders did even worse, losing 39%. However, it could simply be that the share price has been impacted by broader market jitters. It might be worth keeping an eye on the fundamentals, in case there's a good opportunity. Regrettably, last year's performance caps off a bad run, with the shareholders facing a total loss of 13% per year over five years. We realise that Baron Rothschild has said investors should "buy when there is blood on the streets", but we caution that investors should first be sure they are buying a high quality business. It's always interesting to track share price performance over the longer term. But to understand ams-OSRAM better, we need to consider many other factors. For instance, we've identified 2 warning signs for ams-OSRAM (1 is concerning) that you should be aware of.
Of course ams-OSRAM may not be the best stock to buy. So you may wish to see this free collection of growth stocks.
Please note, the market returns quoted in this article reflect the market weighted average returns of stocks that currently trade on CH exchanges.
Have feedback on this article? Concerned about the content? Get in touch with us directly. Alternatively, email editorial-team (at) simplywallst.com.
This article by Simply Wall St is general in nature. We provide commentary based on historical data and analyst forecasts only using an unbiased methodology and our articles are not intended to be financial advice. It does not constitute a recommendation to buy or sell any stock, and does not take account of your objectives, or your financial situation. We aim to bring you long-term focused analysis driven by fundamental data. Note that our analysis may not factor in the latest price-sensitive company announcements or qualitative material. Simply Wall St has no position in any stocks mentioned.
Join A Paid User Research Session
You’ll receive a US$30 Amazon Gift card for 1 hour of your time while helping us build better investing tools for the individual investors like yourself. Sign up here
