
 Yahoo Finance
 How Do Analysts See CME Group Inc. (NASDAQ:CME) Performing Over The Next Year?

Want to participate in a short research study? Help shape the future of investing tools and receive a $20 prize!
Looking at CME Group Inc.’s (NASDAQ:CME) earnings update on 31 December 2018, analyst forecasts seem fairly subdued, with profits predicted to rise by 18% next year relative to the higher past 5-year average growth rate of 32%. By 2020, we can expect CME Group’s bottom line to reach US$2.3b, a jump from the current trailing-twelve-month of US$2.0b. In this article, I’ve outline a few earnings growth rates to give you a sense of the market sentiment for CME Group in the longer term. For those interested in more of an analysis of the company, you can research its fundamentals here.
See our latest analysis for CME Group
What can we expect from CME Group in the longer term?
Over the next three years, it seems the consensus view of the 15 analysts covering CME is skewed towards the positive sentiment. Broker analysts tend to forecast up to three years ahead due to a lack of clarity around the business trajectory beyond this. To get an idea of the overall earnings growth trend for CME, I’ve plotted out each year’s earnings expectations and inserted a line of best fit to determine an annual rate of growth from the slope of this line.
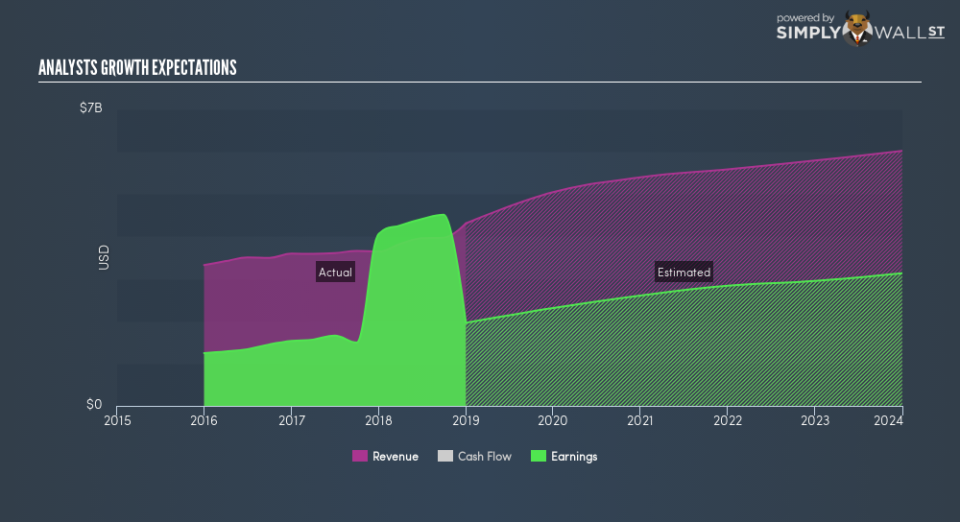
By 2022, CME’s earnings should reach US$2.8b, from current levels of US$2.0b, resulting in an annual growth rate of 9.7%. EPS reaches $7.87 in the final year of forecast compared to the current $5.73 EPS today. In 2022, CME’s profit margin will have expanded from 46% to 51%.
Next Steps:
Future outlook is only one aspect when you’re building an investment case for a stock. For CME Group, I’ve put together three essential factors you should look at:
Financial Health: Does it have a healthy balance sheet? Take a look at our free balance sheet analysis with six simple checks on key factors like leverage and risk.
Valuation: What is CME Group worth today? Is the stock undervalued, even when its growth outlook is factored into its intrinsic value? The intrinsic value infographic in our free research report helps visualize whether CME Group is currently mispriced by the market.
Other High-Growth Alternatives : Are there other high-growth stocks you could be holding instead of CME Group? Explore our interactive list of stocks with large growth potential to get an idea of what else is out there you may be missing!
We aim to bring you long-term focused research analysis driven by fundamental data. Note that our analysis may not factor in the latest price-sensitive company announcements or qualitative material.
If you spot an error that warrants correction, please contact the editor at editorial-team@simplywallst.com. This article by Simply Wall St is general in nature. It does not constitute a recommendation to buy or sell any stock, and does not take account of your objectives, or your financial situation. Simply Wall St has no position in the stocks mentioned. On rare occasion, data errors may occur. Thank you for reading.
