
 Yahoo Finance
 Apollo Food Holdings Berhad (KLSE:APOLLO) Investors Are Less Pessimistic Than Expected
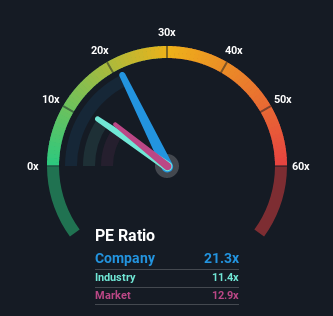
Apollo Food Holdings Berhad's (KLSE:APOLLO) price-to-earnings (or "P/E") ratio of 21.3x might make it look like a strong sell right now compared to the market in Malaysia, where around half of the companies have P/E ratios below 12x and even P/E's below 7x are quite common. Although, it's not wise to just take the P/E at face value as there may be an explanation why it's so lofty.
Earnings have risen firmly for Apollo Food Holdings Berhad recently, which is pleasing to see. It might be that many expect the respectable earnings performance to beat most other companies over the coming period, which has increased investors’ willingness to pay up for the stock. You'd really hope so, otherwise you're paying a pretty hefty price for no particular reason.
View our latest analysis for Apollo Food Holdings Berhad
Want the full picture on earnings, revenue and cash flow for the company? Then our free report on Apollo Food Holdings Berhad will help you shine a light on its historical performance.
Is There Enough Growth For Apollo Food Holdings Berhad?
Apollo Food Holdings Berhad's P/E ratio would be typical for a company that's expected to deliver very strong growth, and importantly, perform much better than the market.
Retrospectively, the last year delivered a decent 12% gain to the company's bottom line. However, this wasn't enough as the latest three year period has seen an unpleasant 13% overall drop in EPS. So unfortunately, we have to acknowledge that the company has not done a great job of growing earnings over that time.
Weighing that medium-term earnings trajectory against the broader market's one-year forecast for expansion of 9.2% shows it's an unpleasant look.
With this information, we find it concerning that Apollo Food Holdings Berhad is trading at a P/E higher than the market. It seems most investors are ignoring the recent poor growth rate and are hoping for a turnaround in the company's business prospects. Only the boldest would assume these prices are sustainable as a continuation of recent earnings trends is likely to weigh heavily on the share price eventually.
What We Can Learn From Apollo Food Holdings Berhad's P/E?
We'd say the price-to-earnings ratio's power isn't primarily as a valuation instrument but rather to gauge current investor sentiment and future expectations.
Our examination of Apollo Food Holdings Berhad revealed its shrinking earnings over the medium-term aren't impacting its high P/E anywhere near as much as we would have predicted, given the market is set to grow. When we see earnings heading backwards and underperforming the market forecasts, we suspect the share price is at risk of declining, sending the high P/E lower. Unless the recent medium-term conditions improve markedly, it's very challenging to accept these prices as being reasonable.
Plus, you should also learn about these 3 warning signs we've spotted with Apollo Food Holdings Berhad (including 1 which can't be ignored).
Of course, you might find a fantastic investment by looking at a few good candidates. So take a peek at this free list of companies with a strong growth track record, trading on a P/E below 20x.
Have feedback on this article? Concerned about the content? Get in touch with us directly. Alternatively, email editorial-team (at) simplywallst.com.
This article by Simply Wall St is general in nature. We provide commentary based on historical data and analyst forecasts only using an unbiased methodology and our articles are not intended to be financial advice. It does not constitute a recommendation to buy or sell any stock, and does not take account of your objectives, or your financial situation. We aim to bring you long-term focused analysis driven by fundamental data. Note that our analysis may not factor in the latest price-sensitive company announcements or qualitative material. Simply Wall St has no position in any stocks mentioned.
Join A Paid User Research Session
You’ll receive a US$30 Amazon Gift card for 1 hour of your time while helping us build better investing tools for the individual investors like yourself. Sign up here
