
 Yahoo Finance
 Is ArcelorMittal’s (AMS:MT) Liquidity Good Enough?

With a market capitalization of US$27.58b, ArcelorMittal (AMS:MT) is a large-cap stock, which is considered by most investors as a safe bet. Common characteristics for these big stocks are their strong balance sheet and high liquidity, which means there’s plenty of stocks available to the public for trading. These firms won’t be left high and dry if liquidity dries up, and they will be relatively unaffected by rises in interest rates. Assessing the most recent data for MT, I will take you through the key ratios to measure financial health, in particular, its solvency and liquidity.
See our latest analysis for ArcelorMittal
How much cash does MT generate through its operations?
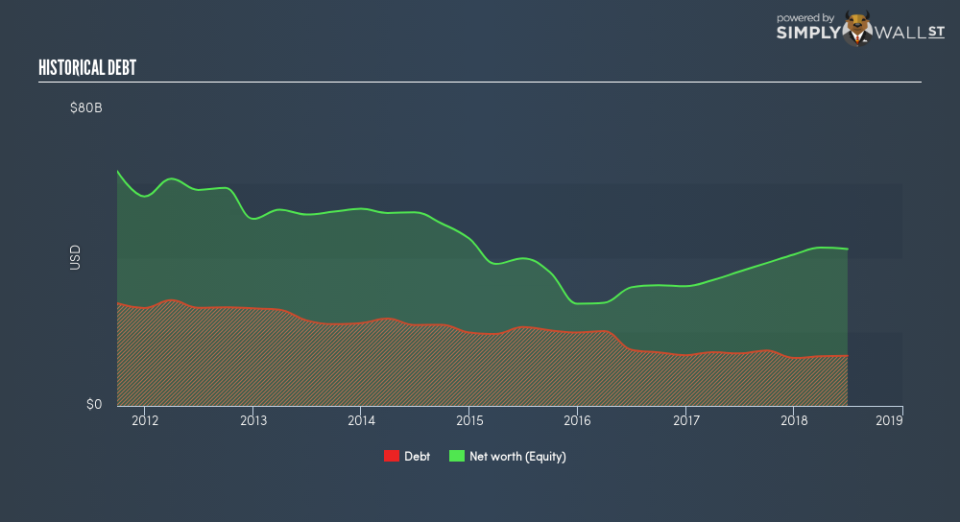
MT has sustained its debt level by about US$13.52b over the last 12 months made up of current and long term debt. At this constant level of debt, MT currently has US$2.94b remaining in cash and short-term investments , ready to deploy into the business. Additionally, MT has produced US$5.04b in operating cash flow during the same period of time, leading to an operating cash to total debt ratio of 37.28%, indicating that MT’s current level of operating cash is high enough to cover debt. This ratio can also be a sign of operational efficiency as an alternative to return on assets. In MT’s case, it is able to generate 0.37x cash from its debt capital.
Does MT’s liquid assets cover its short-term commitments?
Looking at MT’s most recent US$22.71b liabilities, it appears that the company has been able to meet these obligations given the level of current assets of US$31.43b, with a current ratio of 1.38x. For Metals and Mining companies, this ratio is within a sensible range since there is a bit of a cash buffer without leaving too much capital in a low-return environment.
Can MT service its debt comfortably?
With debt at 31.93% of equity, MT may be thought of as appropriately levered. MT is not taking on too much debt commitment, which may be constraining for future growth. We can test if MT’s debt levels are sustainable by measuring interest payments against earnings of a company. As a rule of thumb, a company should have earnings before interest and tax (EBIT) of at least three times the size of net interest. In MT’s case, the ratio of 8.8x suggests that interest is appropriately covered. Strong interest coverage is seen as a responsible and safe practice, which highlights why most investors believe large-caps such as MT is a safe investment.
Next Steps:
MT has demonstrated its ability to generate sufficient levels of cash flow, while its debt hovers at an appropriate level. Furthermore, the company exhibits an ability to meet its near-term obligations, which isn’t a big surprise for a large-cap. I admit this is a fairly basic analysis for MT’s financial health. Other important fundamentals need to be considered alongside. I recommend you continue to research ArcelorMittal to get a better picture of the stock by looking at:
Future Outlook: What are well-informed industry analysts predicting for MT’s future growth? Take a look at our free research report of analyst consensus for MT’s outlook.
Valuation: What is MT worth today? Is the stock undervalued, even when its growth outlook is factored into its intrinsic value? The intrinsic value infographic in our free research report helps visualize whether MT is currently mispriced by the market.
Other High-Performing Stocks: Are there other stocks that provide better prospects with proven track records? Explore our free list of these great stocks here.
To help readers see past the short term volatility of the financial market, we aim to bring you a long-term focused research analysis purely driven by fundamental data. Note that our analysis does not factor in the latest price-sensitive company announcements.
The author is an independent contributor and at the time of publication had no position in the stocks mentioned. For errors that warrant correction please contact the editor at editorial-team@simplywallst.com.
