
 Yahoo Finance
 Do You Like Arvida Group Limited (NZSE:ARV) At This P/E Ratio?

Want to participate in a short research study? Help shape the future of investing tools and you could win a $250 gift card!
This article is for investors who would like to improve their understanding of price to earnings ratios (P/E ratios). To keep it practical, we’ll show how Arvida Group Limited’s (NZSE:ARV) P/E ratio could help you assess the value on offer. Based on the last twelve months, Arvida Group’s P/E ratio is 7.42. That corresponds to an earnings yield of approximately 13%.
View our latest analysis for Arvida Group
How Do You Calculate A P/E Ratio?
The formula for P/E is:
Price to Earnings Ratio = Share Price ÷ Earnings per Share (EPS)
Or for Arvida Group:
P/E of 7.42 = NZ$1.33 ÷ NZ$0.18 (Based on the trailing twelve months to September 2018.)
Is A High Price-to-Earnings Ratio Good?
A higher P/E ratio means that investors are paying a higher price for each NZ$1 of company earnings. That is not a good or a bad thing per se, but a high P/E does imply buyers are optimistic about the future.
How Growth Rates Impact P/E Ratios
Earnings growth rates have a big influence on P/E ratios. That’s because companies that grow earnings per share quickly will rapidly increase the ‘E’ in the equation. That means unless the share price increases, the P/E will reduce in a few years. A lower P/E should indicate the stock is cheap relative to others — and that may attract buyers.
Most would be impressed by Arvida Group earnings growth of 22% in the last year. And its annual EPS growth rate over 5 years is 113%. This could arguably justify a relatively high P/E ratio.
How Does Arvida Group’s P/E Ratio Compare To Its Peers?
The P/E ratio indicates whether the market has higher or lower expectations of a company. The image below shows that Arvida Group has a lower P/E than the average (15.5) P/E for companies in the healthcare industry.
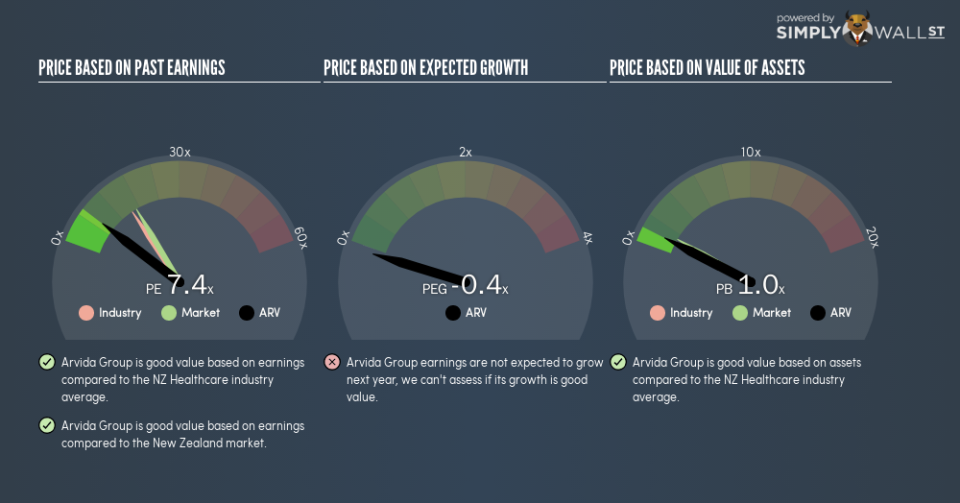
This suggests that market participants think Arvida Group will underperform other companies in its industry. While current expectations are low, the stock could be undervalued if the situation is better than the market assumes. You should delve deeper. I like to check if company insiders have been buying or selling.
Remember: P/E Ratios Don’t Consider The Balance Sheet
It’s important to note that the P/E ratio considers the market capitalization, not the enterprise value. That means it doesn’t take debt or cash into account. Hypothetically, a company could reduce its future P/E ratio by spending its cash (or taking on debt) to achieve higher earnings.
Spending on growth might be good or bad a few years later, but the point is that the P/E ratio does not account for the option (or lack thereof).
How Does Arvida Group’s Debt Impact Its P/E Ratio?
Net debt totals 27% of Arvida Group’s market cap. This is enough debt that you’d have to make some adjustments before using the P/E ratio to compare it to a company with net cash.
The Verdict On Arvida Group’s P/E Ratio
Arvida Group has a P/E of 7.4. That’s below the average in the NZ market, which is 16.9. The company hasn’t stretched its balance sheet, and earnings growth was good last year. If the company can continue to grow earnings, then the current P/E may be unjustifiably low.
Investors should be looking to buy stocks that the market is wrong about. As value investor Benjamin Graham famously said, ‘In the short run, the market is a voting machine but in the long run, it is a weighing machine.’ So this free visual report on analyst forecasts could hold they key to an excellent investment decision.
Of course, you might find a fantastic investment by looking at a few good candidates. So take a peek at this free list of companies with modest (or no) debt, trading on a P/E below 20.
To help readers see past the short term volatility of the financial market, we aim to bring you a long-term focused research analysis purely driven by fundamental data. Note that our analysis does not factor in the latest price-sensitive company announcements.
The author is an independent contributor and at the time of publication had no position in the stocks mentioned. For errors that warrant correction please contact the editor at editorial-team@simplywallst.com.
