
 Yahoo Finance
 Asbury Automotive Group, Inc. (NYSE:ABG) Earns A Nice Return On Capital Employed

Today we'll look at Asbury Automotive Group, Inc. (NYSE:ABG) and reflect on its potential as an investment. Specifically, we'll consider its Return On Capital Employed (ROCE), since that will give us an insight into how efficiently the business can generate profits from the capital it requires.
Firstly, we'll go over how we calculate ROCE. Then we'll compare its ROCE to similar companies. Finally, we'll look at how its current liabilities affect its ROCE.
Understanding Return On Capital Employed (ROCE)
ROCE measures the amount of pre-tax profits a company can generate from the capital employed in its business. All else being equal, a better business will have a higher ROCE. Overall, it is a valuable metric that has its flaws. Author Edwin Whiting says to be careful when comparing the ROCE of different businesses, since 'No two businesses are exactly alike.
How Do You Calculate Return On Capital Employed?
The formula for calculating the return on capital employed is:
Return on Capital Employed = Earnings Before Interest and Tax (EBIT) ÷ (Total Assets - Current Liabilities)
Or for Asbury Automotive Group:
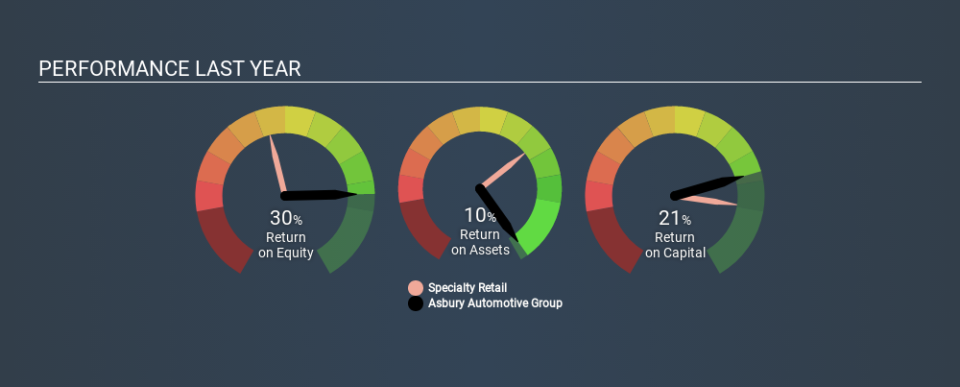
0.21 = US$330m ÷ (US$2.8b - US$1.2b) (Based on the trailing twelve months to September 2019.)
Therefore, Asbury Automotive Group has an ROCE of 21%.
Check out our latest analysis for Asbury Automotive Group
Does Asbury Automotive Group Have A Good ROCE?
One way to assess ROCE is to compare similar companies. Using our data, we find that Asbury Automotive Group's ROCE is meaningfully better than the 11% average in the Specialty Retail industry. We would consider this a positive, as it suggests it is using capital more effectively than other similar companies. Regardless of the industry comparison, in absolute terms, Asbury Automotive Group's ROCE currently appears to be excellent.
You can click on the image below to see (in greater detail) how Asbury Automotive Group's past growth compares to other companies.
Remember that this metric is backwards looking - it shows what has happened in the past, and does not accurately predict the future. ROCE can be misleading for companies in cyclical industries, with returns looking impressive during the boom times, but very weak during the busts. This is because ROCE only looks at one year, instead of considering returns across a whole cycle. Since the future is so important for investors, you should check out our free report on analyst forecasts for Asbury Automotive Group.
Asbury Automotive Group's Current Liabilities And Their Impact On Its ROCE
Liabilities, such as supplier bills and bank overdrafts, are referred to as current liabilities if they need to be paid within 12 months. Due to the way ROCE is calculated, a high level of current liabilities makes a company look as though it has less capital employed, and thus can (sometimes unfairly) boost the ROCE. To check the impact of this, we calculate if a company has high current liabilities relative to its total assets.
Asbury Automotive Group has total assets of US$2.8b and current liabilities of US$1.2b. As a result, its current liabilities are equal to approximately 44% of its total assets. A medium level of current liabilities boosts Asbury Automotive Group's ROCE somewhat.
Our Take On Asbury Automotive Group's ROCE
Even so, it has a great ROCE, and could be an attractive prospect for further research. Asbury Automotive Group looks strong on this analysis, but there are plenty of other companies that could be a good opportunity . Here is a free list of companies growing earnings rapidly.
For those who like to find winning investments this free list of growing companies with recent insider purchasing, could be just the ticket.
If you spot an error that warrants correction, please contact the editor at editorial-team@simplywallst.com. This article by Simply Wall St is general in nature. It does not constitute a recommendation to buy or sell any stock, and does not take account of your objectives, or your financial situation. Simply Wall St has no position in the stocks mentioned.
We aim to bring you long-term focused research analysis driven by fundamental data. Note that our analysis may not factor in the latest price-sensitive company announcements or qualitative material. Thank you for reading.
