
 Yahoo Finance
 Is Ashtead Group plc (LON:AHT) A Financially Sound Company?

Investors pursuing a solid, dependable stock investment can often be led to Ashtead Group plc (LON:AHT), a large-cap worth UK£10.92b. Market participants who are conscious of risk tend to search for large firms, attracted by the prospect of varied revenue sources and strong returns on capital. But, its financial health remains the key to continued success. Let’s take a look at Ashtead Group’s leverage and assess its financial strength to get an idea of their ability to fund strategic acquisitions and grow through cyclical pressures. Note that this information is centred entirely on financial health and is a high-level overview, so I encourage you to look further into AHT here.
View our latest analysis for Ashtead Group
How much cash does AHT generate through its operations?
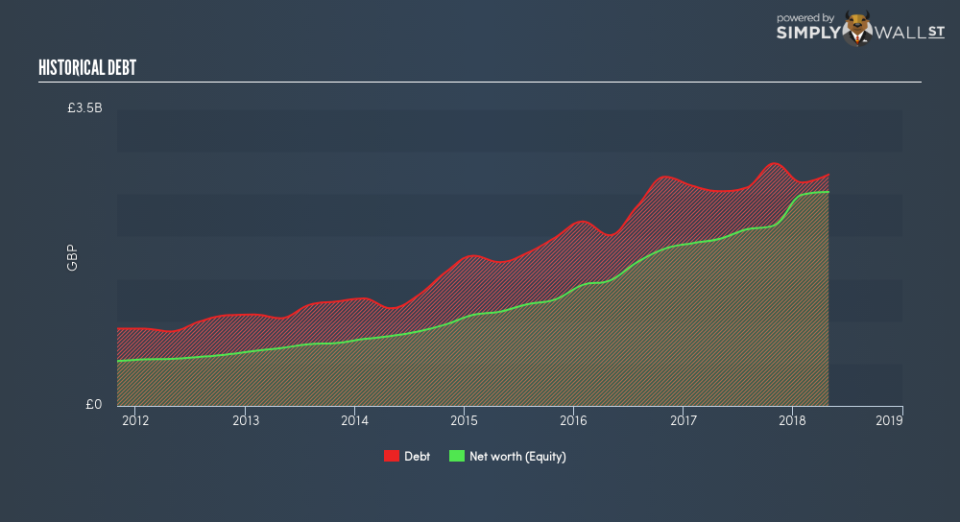
Over the past year, AHT has ramped up its debt from UK£2.53b to UK£2.73b – this includes both the current and long-term debt. With this growth in debt, AHT currently has UK£19.1m remaining in cash and short-term investments for investing into the business. On top of this, AHT has generated cash from operations of UK£518.5m in the last twelve months, leading to an operating cash to total debt ratio of 19.0%, signalling that AHT’s operating cash is not sufficient to cover its debt. This ratio can also be a sign of operational efficiency as an alternative to return on assets. In AHT’s case, it is able to generate 0.19x cash from its debt capital.
Does AHT’s liquid assets cover its short-term commitments?
Looking at AHT’s most recent UK£659.1m liabilities, it seems that the business has maintained a safe level of current assets to meet its obligations, with the current ratio last standing at 1.16x. For Trade Distributors companies, this ratio is within a sensible range since there is a bit of a cash buffer without leaving too much capital in a low-return environment.
Can AHT service its debt comfortably?
With total debt exceeding equities, Ashtead Group is considered a highly levered company. This is not unusual for large-caps since debt tends to be less expensive than equity because interest payments are tax deductible. Since large-caps are seen as safer than their smaller constituents, they tend to enjoy lower cost of capital. We can check to see whether AHT is able to meet its debt obligations by looking at the net interest coverage ratio. As a rule of thumb, a company should have earnings before interest and tax (EBIT) of at least three times the size of net interest. In AHT’s case, the ratio of 7.53x suggests that interest is appropriately covered. It is considered a responsible and reassuring practice to maintain high interest coverage, which makes AHT and other large-cap investments thought to be safe.
Next Steps:
At its current level of cash flow coverage, AHT has room for improvement to better cushion for events which may require debt repayment. Though, the company exhibits an ability to meet its near-term obligations, which isn’t a big surprise for a large-cap. Keep in mind I haven’t considered other factors such as how AHT has been performing in the past. I recommend you continue to research Ashtead Group to get a better picture of the stock by looking at:
Future Outlook: What are well-informed industry analysts predicting for AHT’s future growth? Take a look at our free research report of analyst consensus for AHT’s outlook.
Valuation: What is AHT worth today? Is the stock undervalued, even when its growth outlook is factored into its intrinsic value? The intrinsic value infographic in our free research report helps visualize whether AHT is currently mispriced by the market.
Other High-Performing Stocks: Are there other stocks that provide better prospects with proven track records? Explore our free list of these great stocks here.
To help readers see past the short term volatility of the financial market, we aim to bring you a long-term focused research analysis purely driven by fundamental data. Note that our analysis does not factor in the latest price-sensitive company announcements.
The author is an independent contributor and at the time of publication had no position in the stocks mentioned. For errors that warrant correction please contact the editor at editorial-team@simplywallst.com.
