
 Yahoo Finance
 AUD/USD Forex Technical Analysis – Trigger Point for Possible Acceleration to Upside is .7897
The AUD/USD is trading higher early Thursday in reaction to a jump in retail sales. According to the Australian Bureau of Statistics (ABS), retail sales surged 1.2 percent in November from October, when they rose a solid 0.5 percent. The new figure was three times better than the market forecast and the steepest gain since early 2013.
Daily Swing Chart Analysis
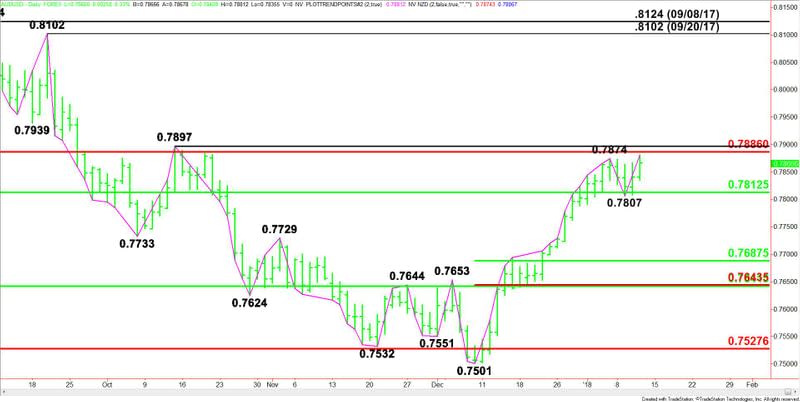
The main trend is up according to the daily swing chart. The uptrend was reaffirmed earlier today when the AUD/USD crossed the previous top at .7874. The next target is the October 13 main top at .7897. This is a possible trigger point for an acceleration to the upside with the September 20 main top at .8102 the next likely upside target.
The trend will change to down if .7807 is taken out.
The major retracement zone is .7812 to .7886. Trader reaction to this zone will determine the near-term direction of the market.
Daily Swing Chart Forecast
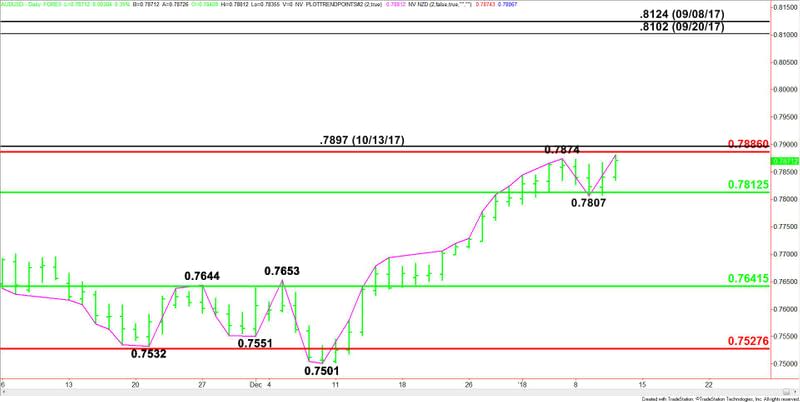
Based on the current price at .7870 (0404 GMT), the direction of the AUD/USD the rest of the session will be determined by trader reaction to .7874.
A sustained move over .7874 will indicate the presence buyers. If volume continues to increase on the rally then look for a move into the Fibonacci level at .7886 and the main top at .7897. The latter is the trigger point for a possible acceleration to the upside.
The inability to sustain a rally over .7874 will signal that the earlier rally through this top was fueled by short-covering and buy stops, rather than new buying. This could trigger a pullback into the major 50% level at .7812 then the main bottom at .7807.
If volume increases on a move through .7807 then look for a possible acceleration to the upside.
This article was originally posted on FX Empire
