
 Yahoo Finance
 AUD/USD Forex Technical Analysis – Trend Up, Momentum Down with Next Targets .7207 to .7199
The Australian Dollar is getting pressured for a third straight session on Thursday. Weaker-than-expected economic data continues to drive the price action with sellers getting additional help from increasing worries over U.S.-China trade relations. Yesterday, trader reaction to softer-than-expected economic growth data fueled a steep sell-off. Today, it’s flat retail sales data and a shrinking trade surplus. Further complicating trade negotiations between the U.S. and China was the arrest of the Huawei CFO.
At 0618 GMT, the AUD/USD is trading .7228, down 0.0042 or -0.58%.
Daily Swing Chart Technical Analysis
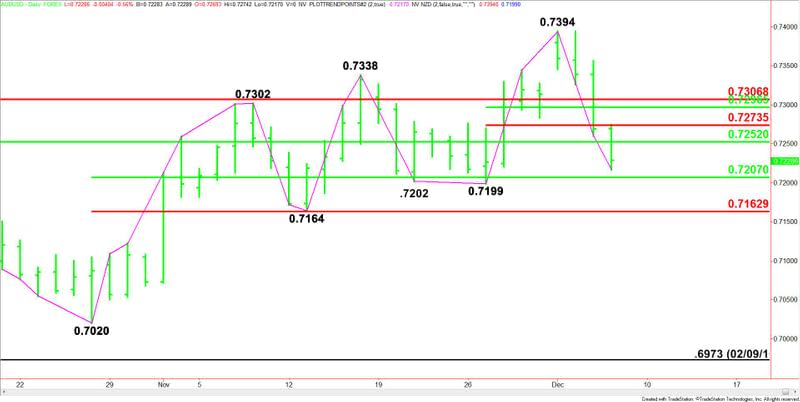
The main trend is up according to the daily swing chart, however, momentum is trending lower. The main trend changes to down on a trade through .7199. A move through .7394 will signal a resumption of the uptrend.
The minor trend is down. It turned down on Wednesday when sellers took out the minor bottom at .7284. This move shifted momentum to the downside.
The AUD/USD is also trading on the weak side of a major retracement zone and a short-term retracement zone. These levels are new resistance at .7252, .7274, .7297 and .7307.
On the downside, retracement zone support is at .7207 to .7163. Inside this zone are a pair of bottoms at .7199 and .7164.
Daily Swing Chart Technical Forecast
Based on the early price action and the current price at .7228, the direction of the AUD/USD the rest of the session is likely to be determined by trader reaction to the main 50% level at .7252.
Bullish Scenario
A sustained move over .7252 will indicate the return of buyers. Overcoming .7274 will indicate the buying is getting stronger. This could trigger a move into a resistance cluster at .7297 to .7307.
Bearish Scenario
A sustained move under .7252 will signal the presence of sellers. The next target is the 50% level at .7207, followed closely by the main bottom at .7199. This is a potential trigger point for an acceleration into the next main bottom at .7164, followed by the Fibonacci level at .7163.
This article was originally posted on FX Empire
