
 Yahoo Finance
 Baker Hughes' (NASDAQ:BKR) Returns On Capital Are Heading Higher
If you're not sure where to start when looking for the next multi-bagger, there are a few key trends you should keep an eye out for. One common approach is to try and find a company with returns on capital employed (ROCE) that are increasing, in conjunction with a growing amount of capital employed. Put simply, these types of businesses are compounding machines, meaning they are continually reinvesting their earnings at ever-higher rates of return. So when we looked at Baker Hughes (NASDAQ:BKR) and its trend of ROCE, we really liked what we saw.
Understanding Return On Capital Employed (ROCE)
For those that aren't sure what ROCE is, it measures the amount of pre-tax profits a company can generate from the capital employed in its business. The formula for this calculation on Baker Hughes is:
Return on Capital Employed = Earnings Before Interest and Tax (EBIT) ÷ (Total Assets - Current Liabilities)
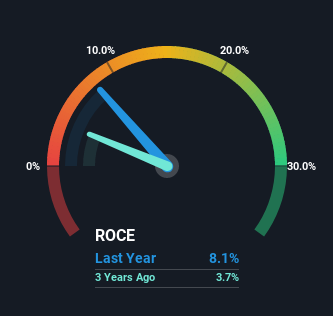
0.081 = US$1.9b ÷ (US$34b - US$11b) (Based on the trailing twelve months to December 2022).
Therefore, Baker Hughes has an ROCE of 8.1%. In absolute terms, that's a low return but it's around the Energy Services industry average of 9.0%.
View our latest analysis for Baker Hughes
In the above chart we have measured Baker Hughes' prior ROCE against its prior performance, but the future is arguably more important. If you'd like to see what analysts are forecasting going forward, you should check out our free report for Baker Hughes.
What Does the ROCE Trend For Baker Hughes Tell Us?
Baker Hughes has not disappointed in regards to ROCE growth. The figures show that over the last five years, returns on capital have grown by 506%. The company is now earning US$0.08 per dollar of capital employed. Interestingly, the business may be becoming more efficient because it's applying 51% less capital than it was five years ago. Baker Hughes may be selling some assets so it's worth investigating if the business has plans for future investments to increase returns further still.
For the record though, there was a noticeable increase in the company's current liabilities over the period, so we would attribute some of the ROCE growth to that. Effectively this means that suppliers or short-term creditors are now funding 32% of the business, which is more than it was five years ago. It's worth keeping an eye on this because as the percentage of current liabilities to total assets increases, some aspects of risk also increase.
What We Can Learn From Baker Hughes' ROCE
In the end, Baker Hughes has proven it's capital allocation skills are good with those higher returns from less amount of capital. Considering the stock has delivered 19% to its stockholders over the last five years, it may be fair to think that investors aren't fully aware of the promising trends yet. So exploring more about this stock could uncover a good opportunity, if the valuation and other metrics stack up.
On a separate note, we've found 1 warning sign for Baker Hughes you'll probably want to know about.
For those who like to invest in solid companies, check out this free list of companies with solid balance sheets and high returns on equity.
Have feedback on this article? Concerned about the content? Get in touch with us directly. Alternatively, email editorial-team (at) simplywallst.com.
This article by Simply Wall St is general in nature. We provide commentary based on historical data and analyst forecasts only using an unbiased methodology and our articles are not intended to be financial advice. It does not constitute a recommendation to buy or sell any stock, and does not take account of your objectives, or your financial situation. We aim to bring you long-term focused analysis driven by fundamental data. Note that our analysis may not factor in the latest price-sensitive company announcements or qualitative material. Simply Wall St has no position in any stocks mentioned.
Join A Paid User Research Session
You’ll receive a US$30 Amazon Gift card for 1 hour of your time while helping us build better investing tools for the individual investors like yourself. Sign up here
