
 Yahoo Finance
 Bank OZK's (NASDAQ:OZK) three-year earnings growth trails the 11% YoY shareholder returns
While Bank OZK (NASDAQ:OZK) shareholders are probably generally happy, the stock hasn't had particularly good run recently, with the share price falling 17% in the last quarter. In contrast the stock is up over the last three years. Arguably you'd have been better off buying an index fund, because the gain of 24% in three years isn't amazing.
The past week has proven to be lucrative for Bank OZK investors, so let's see if fundamentals drove the company's three-year performance.
See our latest analysis for Bank OZK
While the efficient markets hypothesis continues to be taught by some, it has been proven that markets are over-reactive dynamic systems, and investors are not always rational. One flawed but reasonable way to assess how sentiment around a company has changed is to compare the earnings per share (EPS) with the share price.
Bank OZK was able to grow its EPS at 13% per year over three years, sending the share price higher. The average annual share price increase of 7% is actually lower than the EPS growth. So it seems investors have become more cautious about the company, over time. We'd venture the lowish P/E ratio of 8.36 also reflects the negative sentiment around the stock.
The company's earnings per share (over time) is depicted in the image below (click to see the exact numbers).
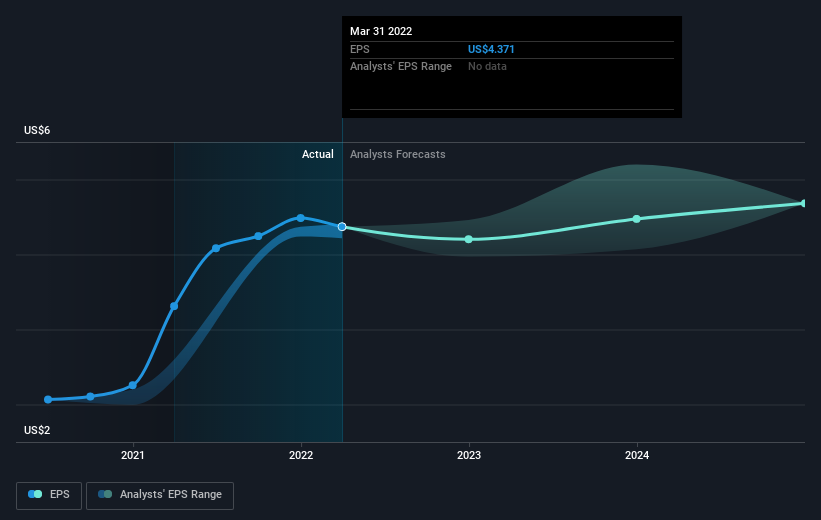
We know that Bank OZK has improved its bottom line lately, but is it going to grow revenue? You could check out this free report showing analyst revenue forecasts.
What About Dividends?
It is important to consider the total shareholder return, as well as the share price return, for any given stock. Whereas the share price return only reflects the change in the share price, the TSR includes the value of dividends (assuming they were reinvested) and the benefit of any discounted capital raising or spin-off. It's fair to say that the TSR gives a more complete picture for stocks that pay a dividend. As it happens, Bank OZK's TSR for the last 3 years was 38%, which exceeds the share price return mentioned earlier. The dividends paid by the company have thusly boosted the total shareholder return.
A Different Perspective
While it's certainly disappointing to see that Bank OZK shares lost 5.9% throughout the year, that wasn't as bad as the market loss of 11%. Unfortunately, last year's performance may indicate unresolved challenges, given that it's worse than the annualised loss of 0.2% over the last half decade. While some investors do well specializing in buying companies that are struggling (but nonetheless undervalued), don't forget that Buffett said that 'turnarounds seldom turn'. It's always interesting to track share price performance over the longer term. But to understand Bank OZK better, we need to consider many other factors. Even so, be aware that Bank OZK is showing 1 warning sign in our investment analysis , you should know about...
We will like Bank OZK better if we see some big insider buys. While we wait, check out this free list of growing companies with considerable, recent, insider buying.
Please note, the market returns quoted in this article reflect the market weighted average returns of stocks that currently trade on US exchanges.
Have feedback on this article? Concerned about the content? Get in touch with us directly. Alternatively, email editorial-team (at) simplywallst.com.
This article by Simply Wall St is general in nature. We provide commentary based on historical data and analyst forecasts only using an unbiased methodology and our articles are not intended to be financial advice. It does not constitute a recommendation to buy or sell any stock, and does not take account of your objectives, or your financial situation. We aim to bring you long-term focused analysis driven by fundamental data. Note that our analysis may not factor in the latest price-sensitive company announcements or qualitative material. Simply Wall St has no position in any stocks mentioned.
