
 Yahoo Finance
 Is Barnes Group Inc’s (NYSE:B) Balance Sheet Strong Enough To Weather A Storm?

Small-caps and large-caps are wildly popular among investors; however, mid-cap stocks, such as Barnes Group Inc (NYSE:B) with a market-capitalization of US$3.57b, rarely draw their attention. While they are less talked about as an investment category, mid-cap risk-adjusted returns have generally been better than more commonly focused stocks that fall into the small- or large-cap categories. Let’s take a look at B’s debt concentration and assess their financial liquidity to get an idea of their ability to fund strategic acquisitions and grow through cyclical pressures. Note that this commentary is very high-level and solely focused on financial health, so I suggest you dig deeper yourself into B here.
See our latest analysis for Barnes Group
How does B’s operating cash flow stack up against its debt?
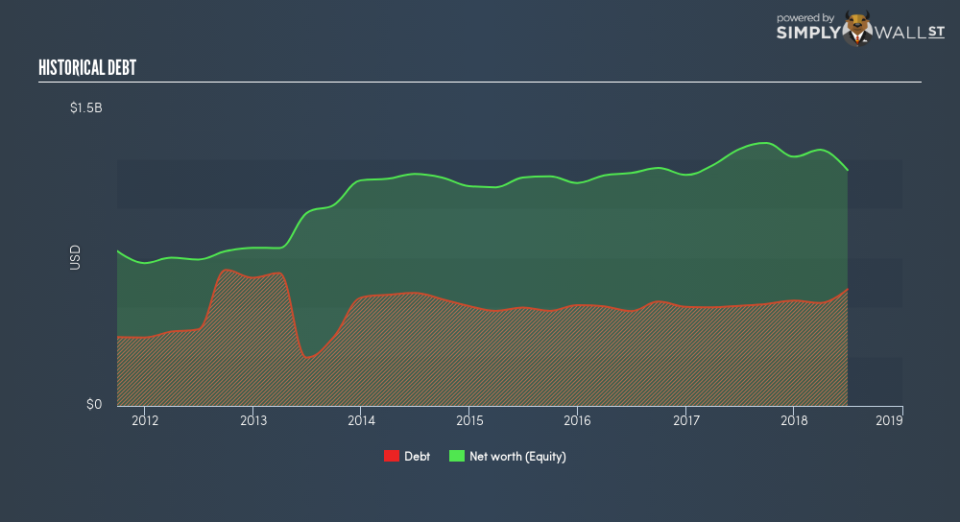
B has built up its total debt levels in the last twelve months, from US$506.6m to US$590.3m , which is made up of current and long term debt. With this growth in debt, B currently has US$120.5m remaining in cash and short-term investments , ready to deploy into the business. Additionally, B has generated cash from operations of US$190.1m over the same time period, leading to an operating cash to total debt ratio of 32.2%, meaning that B’s operating cash is sufficient to cover its debt. This ratio can also be interpreted as a measure of efficiency as an alternative to return on assets. In B’s case, it is able to generate 0.32x cash from its debt capital.
Does B’s liquid assets cover its short-term commitments?
Looking at B’s most recent US$358.1m liabilities, the company has been able to meet these obligations given the level of current assets of US$806.2m, with a current ratio of 2.25x. For Machinery companies, this ratio is within a sensible range since there’s sufficient cash cushion without leaving too much capital idle or in low-earning investments.
Is B’s debt level acceptable?
With a debt-to-equity ratio of 49.5%, B can be considered as an above-average leveraged company. This is not uncommon for a mid-cap company given that debt tends to be lower-cost and at times, more accessible. We can check to see whether B is able to meet its debt obligations by looking at the net interest coverage ratio. A company generating earnings before interest and tax (EBIT) at least three times its net interest payments is considered financially sound. In B’s, case, the ratio of 15.03x suggests that interest is comfortably covered, which means that lenders may be inclined to lend more money to the company, as it is seen as safe in terms of payback.
Next Steps:
B’s high cash coverage means that, although its debt levels are high, the company is able to utilise its borrowings efficiently in order to generate cash flow. Since there is also no concerns around B’s liquidity needs, this may be its optimal capital structure for the time being. This is only a rough assessment of financial health, and I’m sure B has company-specific issues impacting its capital structure decisions. You should continue to research Barnes Group to get a better picture of the mid-cap by looking at:
Future Outlook: What are well-informed industry analysts predicting for B’s future growth? Take a look at our free research report of analyst consensus for B’s outlook.
Valuation: What is B worth today? Is the stock undervalued, even when its growth outlook is factored into its intrinsic value? The intrinsic value infographic in our free research report helps visualize whether B is currently mispriced by the market.
Other High-Performing Stocks: Are there other stocks that provide better prospects with proven track records? Explore our free list of these great stocks here.
To help readers see past the short term volatility of the financial market, we aim to bring you a long-term focused research analysis purely driven by fundamental data. Note that our analysis does not factor in the latest price-sensitive company announcements.
The author is an independent contributor and at the time of publication had no position in the stocks mentioned. For errors that warrant correction please contact the editor at editorial-team@simplywallst.com.
