
 Yahoo Finance
 Based On Its ROE, Is Taylor Devices, Inc. (NASDAQ:TAYD) A High Quality Stock?

While some investors are already well versed in financial metrics (hat tip), this article is for those who would like to learn about Return On Equity (ROE) and why it is important. To keep the lesson grounded in practicality, we'll use ROE to better understand Taylor Devices, Inc. (NASDAQ:TAYD).
Our data shows Taylor Devices has a return on equity of 7.2% for the last year. One way to conceptualize this, is that for each $1 of shareholders' equity it has, the company made $0.07 in profit.
View our latest analysis for Taylor Devices
How Do I Calculate ROE?
The formula for ROE is:
Return on Equity = Net Profit (from continuing operations) ÷ Shareholders' Equity
Or for Taylor Devices:
7.2% = US$2.7m ÷ US$38m (Based on the trailing twelve months to November 2019.)
Most readers would understand what net profit is, but it’s worth explaining the concept of shareholders’ equity. It is the capital paid in by shareholders, plus any retained earnings. You can calculate shareholders' equity by subtracting the company's total liabilities from its total assets.
What Does ROE Signify?
ROE looks at the amount a company earns relative to the money it has kept within the business. The 'return' is the yearly profit. The higher the ROE, the more profit the company is making. So, all else equal, investors should like a high ROE. That means ROE can be used to compare two businesses.
Does Taylor Devices Have A Good Return On Equity?
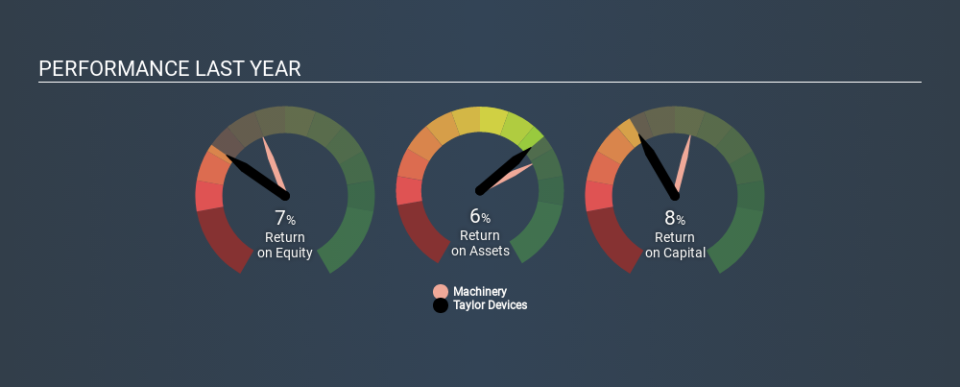
One simple way to determine if a company has a good return on equity is to compare it to the average for its industry. The limitation of this approach is that some companies are quite different from others, even within the same industry classification. As shown in the graphic below, Taylor Devices has a lower ROE than the average (13%) in the Machinery industry classification.
Unfortunately, that's sub-optimal. We'd prefer see an ROE above the industry average, but it might not matter if the company is undervalued. Still, shareholders might want to check if insiders have been selling.
How Does Debt Impact Return On Equity?
Companies usually need to invest money to grow their profits. The cash for investment can come from prior year profits (retained earnings), issuing new shares, or borrowing. In the first two cases, the ROE will capture this use of capital to grow. In the latter case, the use of debt will improve the returns, but will not change the equity. Thus the use of debt can improve ROE, albeit along with extra risk in the case of stormy weather, metaphorically speaking.
Combining Taylor Devices's Debt And Its 7.2% Return On Equity
Taylor Devices is free of net debt, which is a positive for shareholders. Although I don't find its ROE that impressive, it's worth remembering it achieved these returns without debt. After all, with cash on the balance sheet, a company has a lot more optionality in good times and bad.
The Key Takeaway
Return on equity is a useful indicator of the ability of a business to generate profits and return them to shareholders. In my book the highest quality companies have high return on equity, despite low debt. If two companies have around the same level of debt to equity, and one has a higher ROE, I'd generally prefer the one with higher ROE.
But ROE is just one piece of a bigger puzzle, since high quality businesses often trade on high multiples of earnings. It is important to consider other factors, such as future profit growth -- and how much investment is required going forward. Check the past profit growth by Taylor Devices by looking at this visualization of past earnings, revenue and cash flow.
Of course, you might find a fantastic investment by looking elsewhere. So take a peek at this free list of interesting companies.
If you spot an error that warrants correction, please contact the editor at editorial-team@simplywallst.com. This article by Simply Wall St is general in nature. It does not constitute a recommendation to buy or sell any stock, and does not take account of your objectives, or your financial situation. Simply Wall St has no position in the stocks mentioned.
We aim to bring you long-term focused research analysis driven by fundamental data. Note that our analysis may not factor in the latest price-sensitive company announcements or qualitative material. Thank you for reading.
