
 Yahoo Finance
 Based On Its ROE, Is TIL Logistics Group Limited (NZSE:TLL) A High Quality Stock?
One of the best investments we can make is in our own knowledge and skill set. With that in mind, this article will work through how we can use Return On Equity (ROE) to better understand a business. We'll use ROE to examine TIL Logistics Group Limited (NZSE:TLL), by way of a worked example.
Return on Equity or ROE is a test of how effectively a company is growing its value and managing investors’ money. Put another way, it reveals the company's success at turning shareholder investments into profits.
View our latest analysis for TIL Logistics Group
How Is ROE Calculated?
ROE can be calculated by using the formula:
Return on Equity = Net Profit (from continuing operations) ÷ Shareholders' Equity
So, based on the above formula, the ROE for TIL Logistics Group is:
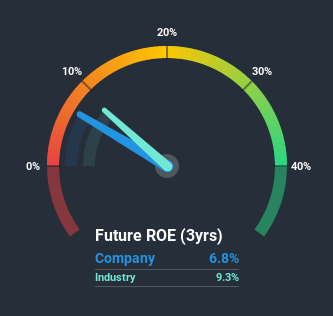
6.8% = NZ$2.5m ÷ NZ$37m (Based on the trailing twelve months to June 2020).
The 'return' is the income the business earned over the last year. That means that for every NZ$1 worth of shareholders' equity, the company generated NZ$0.07 in profit.
Does TIL Logistics Group Have A Good ROE?
By comparing a company's ROE with its industry average, we can get a quick measure of how good it is. The limitation of this approach is that some companies are quite different from others, even within the same industry classification. If you look at the image below, you can see TIL Logistics Group has a lower ROE than the average (9.3%) in the Logistics industry classification.
That certainly isn't ideal. However, a low ROE is not always bad. If the company's debt levels are moderate to low, then there's still a chance that returns can be improved via the use of financial leverage. A company with high debt levels and low ROE is a combination we like to avoid given the risk involved. Our risks dashboard should have the 4 risks we have identified for TIL Logistics Group.
How Does Debt Impact ROE?
Virtually all companies need money to invest in the business, to grow profits. That cash can come from retained earnings, issuing new shares (equity), or debt. In the first two cases, the ROE will capture this use of capital to grow. In the latter case, the debt used for growth will improve returns, but won't affect the total equity. That will make the ROE look better than if no debt was used.
Combining TIL Logistics Group's Debt And Its 6.8% Return On Equity
It's worth noting the high use of debt by TIL Logistics Group, leading to its debt to equity ratio of 2.34. The combination of a rather low ROE and significant use of debt is not particularly appealing. Investors should think carefully about how a company might perform if it was unable to borrow so easily, because credit markets do change over time.
Summary
Return on equity is useful for comparing the quality of different businesses. Companies that can achieve high returns on equity without too much debt are generally of good quality. If two companies have around the same level of debt to equity, and one has a higher ROE, I'd generally prefer the one with higher ROE.
But when a business is high quality, the market often bids it up to a price that reflects this. The rate at which profits are likely to grow, relative to the expectations of profit growth reflected in the current price, must be considered, too. You can see how the company has grow in the past by looking at this FREE detailed graph of past earnings, revenue and cash flow.
If you would prefer check out another company -- one with potentially superior financials -- then do not miss this free list of interesting companies, that have HIGH return on equity and low debt.
This article by Simply Wall St is general in nature. It does not constitute a recommendation to buy or sell any stock, and does not take account of your objectives, or your financial situation. We aim to bring you long-term focused analysis driven by fundamental data. Note that our analysis may not factor in the latest price-sensitive company announcements or qualitative material. Simply Wall St has no position in any stocks mentioned.
Have feedback on this article? Concerned about the content? Get in touch with us directly. Alternatively, email editorial-team (at) simplywallst.com.
