
 Yahoo Finance
 Baxter International (NYSE:BAX) shareholders are up 5.8% this past week, but still in the red over the last three years
Baxter International Inc. (NYSE:BAX) shareholders should be happy to see the share price up 11% in the last month. But that cannot eclipse the less-than-impressive returns over the last three years. Truth be told the share price declined 51% in three years and that return, Dear Reader, falls short of what you could have got from passive investing with an index fund.
While the stock has risen 5.8% in the past week but long term shareholders are still in the red, let's see what the fundamentals can tell us.
Check out our latest analysis for Baxter International
While markets are a powerful pricing mechanism, share prices reflect investor sentiment, not just underlying business performance. One imperfect but simple way to consider how the market perception of a company has shifted is to compare the change in the earnings per share (EPS) with the share price movement.
Over the three years that the share price declined, Baxter International's earnings per share (EPS) dropped significantly, falling to a loss. Extraordinary items contributed to this situation. Since the company has fallen to a loss making position, it's hard to compare the change in EPS with the share price change. However, we can say we'd expect to see a falling share price in this scenario.
The image below shows how EPS has tracked over time (if you click on the image you can see greater detail).
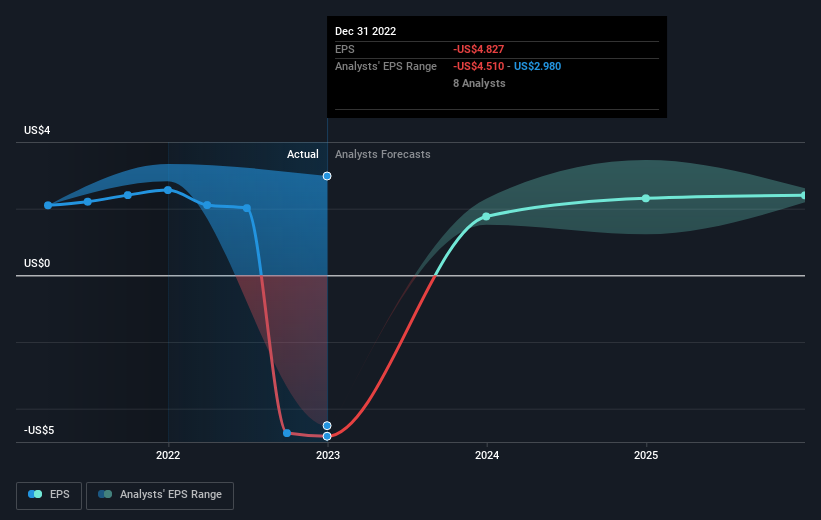
This free interactive report on Baxter International's earnings, revenue and cash flow is a great place to start, if you want to investigate the stock further.
What About Dividends?
As well as measuring the share price return, investors should also consider the total shareholder return (TSR). The TSR is a return calculation that accounts for the value of cash dividends (assuming that any dividend received was reinvested) and the calculated value of any discounted capital raisings and spin-offs. So for companies that pay a generous dividend, the TSR is often a lot higher than the share price return. In the case of Baxter International, it has a TSR of -48% for the last 3 years. That exceeds its share price return that we previously mentioned. The dividends paid by the company have thusly boosted the total shareholder return.
A Different Perspective
While the broader market lost about 9.2% in the twelve months, Baxter International shareholders did even worse, losing 45% (even including dividends). However, it could simply be that the share price has been impacted by broader market jitters. It might be worth keeping an eye on the fundamentals, in case there's a good opportunity. Regrettably, last year's performance caps off a bad run, with the shareholders facing a total loss of 6% per year over five years. Generally speaking long term share price weakness can be a bad sign, though contrarian investors might want to research the stock in hope of a turnaround. While it is well worth considering the different impacts that market conditions can have on the share price, there are other factors that are even more important. Take risks, for example - Baxter International has 2 warning signs we think you should be aware of.
Of course Baxter International may not be the best stock to buy. So you may wish to see this free collection of growth stocks.
Please note, the market returns quoted in this article reflect the market weighted average returns of stocks that currently trade on American exchanges.
Have feedback on this article? Concerned about the content? Get in touch with us directly. Alternatively, email editorial-team (at) simplywallst.com.
This article by Simply Wall St is general in nature. We provide commentary based on historical data and analyst forecasts only using an unbiased methodology and our articles are not intended to be financial advice. It does not constitute a recommendation to buy or sell any stock, and does not take account of your objectives, or your financial situation. We aim to bring you long-term focused analysis driven by fundamental data. Note that our analysis may not factor in the latest price-sensitive company announcements or qualitative material. Simply Wall St has no position in any stocks mentioned.
Join A Paid User Research Session
You’ll receive a US$30 Amazon Gift card for 1 hour of your time while helping us build better investing tools for the individual investors like yourself. Sign up here
