
 Yahoo Finance
 Berkshire (BRK.B) Q3 Earnings Up Y/Y on Solid Segmental Show
Berkshire Hathaway Inc. BRK.B delivered third-quarter operating earnings of $7.9 billion, which increased 14.2% year over year.
This improvement was mainly due to better performance across all its segments.
Behind the Headlines
Revenues increased 2.4% year over year to nearly $64 billion.
Costs and expenses increased 1.3% year over year to $56.1 billion.
Pre-tax income came in at $20.5 billion, down 11.5% year over year.
Berkshire Hathaway Inc. Price, Consensus and EPS Surprise
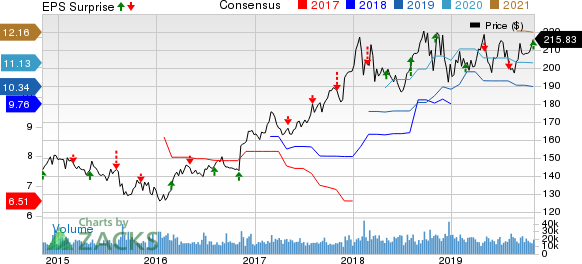
Berkshire Hathaway Inc. price-consensus-eps-surprise-chart | Berkshire Hathaway Inc. Quote
Segment Results
Berkshire Hathaway’s huge and growing Insurance Operations segment has kept its underwriting profit streak alive for more than 15 years. Revenues from the Insurance group increased 8.4% year over year to $17.1 billion. This segment’s net earnings attributable to Berkshire Hathaway were $1.9 billion, up 14.5% year over year.
Railroad, Utilities and Energy operating revenues decreased 0.8% year over year to $11.7 billion owing to lower contribution from Burlington Northern SantaFe Corp. (BNSF). Net earnings of $2.6 billion were up 6.4% year over year driven by 5.2% increase from railroad business as well as an 8% increase from the utilities and energy business. Earnings of railroad business benefited from higher rates per car/unit, a curtailment gain related to an amendment to defined benefit retirement plans and ongoing operating cost control initiatives.
Total revenues at Manufacturing, Service and Retailing rose 0.4% year over year to $35.9 billion. Net earnings grew 1.8% year over year to $2.5 billion.
Financial Position
As of Sep 30, 2019, consolidated shareholders’ equity was $397.6 billion, up 14% from the level as of Dec 31, 2018. At quarter-end, cash and cash equivalents were $74.8 billion, up 146.3% from the level at 2018 end.
Berkshire’s debt was $102.2 billion as on Sep 30, 2019, a 4.8% increase since Dec 31, 2018.
The company exited the third quarter with a float of about $127 billion, up $4 billion from year-end 2018.
Cash flow from operating activities totaled $26.6 billion in the first nine months of 2019, up 0.2% year over year.
Zacks Rank
Berkshire Hathaway currently carries a Zacks Rank #4 (Sell).
You can see the complete list of today’s Zacks #1 Rank (Strong Buy) stocks here.
Performance of Other P&C Insurers
Third-quarter earnings of The Progressive Corporation PGR and RLI Corp. RLI beat the respective Zacks Consensus Estimate for earnings while that of The Travelers Companies TRV missed the same.
Biggest Tech Breakthrough in a Generation
Be among the early investors in the new type of device that experts say could impact society as much as the discovery of electricity. Current technology will soon be outdated and replaced by these new devices. In the process, it’s expected to create 22 million jobs and generate $12.3 trillion in activity.
A select few stocks could skyrocket the most as rollout accelerates for this new tech. Early investors could see gains similar to buying Microsoft in the 1990s. Zacks’ just-released special report reveals 8 stocks to watch. The report is only available for a limited time.
See 8 breakthrough stocks now>>
Want the latest recommendations from Zacks Investment Research? Today, you can download 7 Best Stocks for the Next 30 Days. Click to get this free report
The Progressive Corporation (PGR) : Free Stock Analysis Report
Berkshire Hathaway Inc. (BRK.B) : Free Stock Analysis Report
The Travelers Companies, Inc. (TRV) : Free Stock Analysis Report
RLI Corp. (RLI) : Free Stock Analysis Report
To read this article on Zacks.com click here.
