
 Yahoo Finance
 Bitcoin Accumulation Process – Triumph or Failure?
Bitcoin price analysis
Bitcoin’s (BTC/USD) consolidation process is the main price action theme over the past four months. This kind of activity suggests that traders and investors are accumulating the digital asset, having in mind an assumption, that prices are relatively cheap at this level. The leading cryptocurrency quarterly price average crossed its monthly price average from the upside towards the downside, suggesting a temporary price recovery. However, the accumulation process will prove successful in case Bitcoin’s price will cross its 8,500 Key downtrend resistance level.
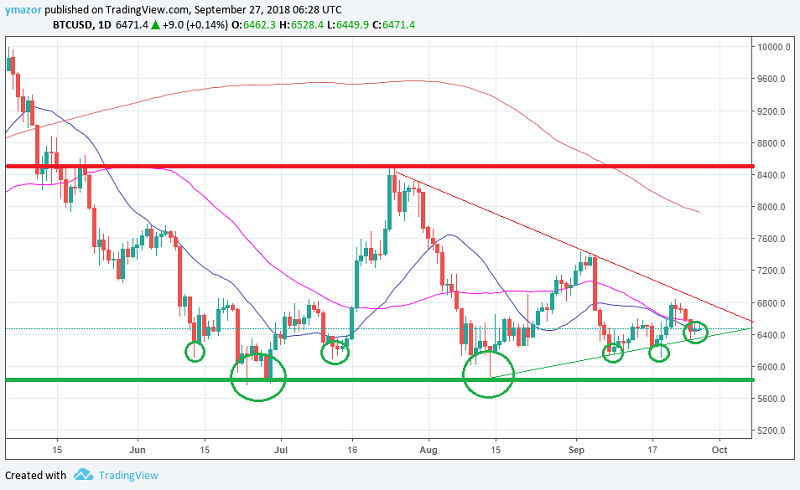
Support levels:
Weak: 6,150 Strong: 6,000 Key: 5,800
Resistance levels:
Weak: 6,850 Strong: 7,415 Key: 8,500
Average prices:
Month: 6,446 Quarter: 6,564 Year: 7,928
Bitcoin Cash price analysis
Bitcoin Cash (BCH/USD) gained more than 20% on September 18. However, the 600 region remains a strong resistance level that Bitcoin Cash has not been able to test.
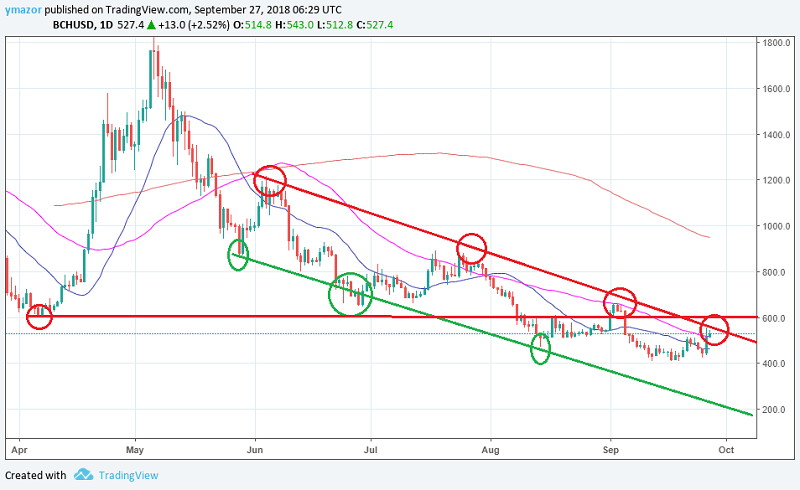
Support levels:
Weak: 470.0 Strong: 424.0 Key: 408.0
Resistance levels:
Weak: 555.0 Strong: 600.0 Key: 660.0
Average prices:
Month: 464.8 Quarter: 517.7 Year: 948.8
Ethereum price analysis
Ethereum (ETH/USD) is under a strong selling pressure, most probably with the support of its founder recent announcements. Adding to that fact the lack of technical recovery signals, Ether is expected to trade under pressure, waiting for a game changer to perform a recovery price action.
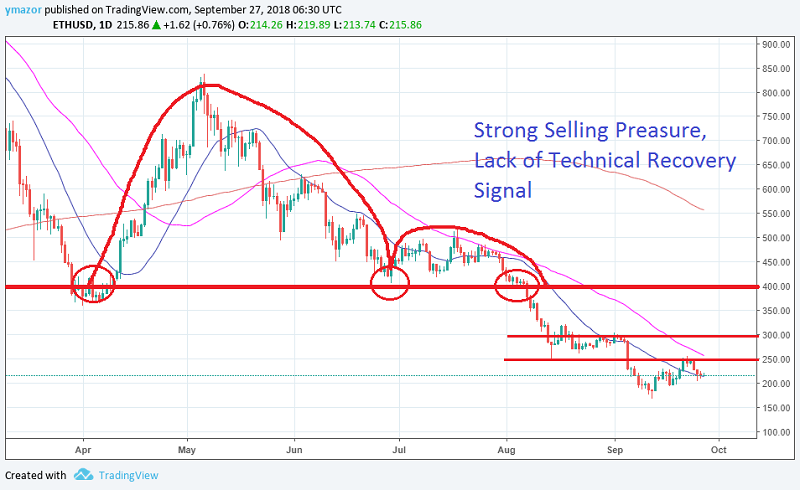
Support levels:
Weak: 200.0 Strong: 192.0 Key: 167.0
Resistance levels:
Weak: 255.0 Strong: 270.0 Key: 300.0
Average prices:
Month: 213.5 Quarter: 257.0 Year: 556.5
Litecoin price analysis
Litecoin (LTC/USD) is range trading between its 50 key support region and the 70-downtrend resistance level. The downtrend is valid, as long as the cryptocurrency is trading below the 70 mark.
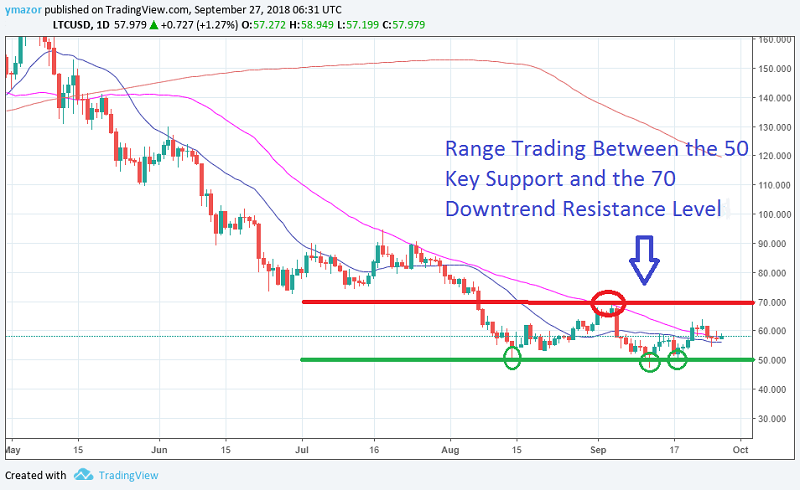
Support levels:
Weak: 54.30 Strong: 50.00 Key: 48.00
Resistance levels:
Weak: 60.00 Strong: 63.80 Key: 70.00
Average prices:
Month: 55.99 Quarter: 57.92 Year: 119.58
XRP price analysis
XRP (XRP/USD) is showing signs of historical performance duplication. The daily chart shows XRP is building a technical pattern resembling its April 2018 performance. Seems like history repeats itself…
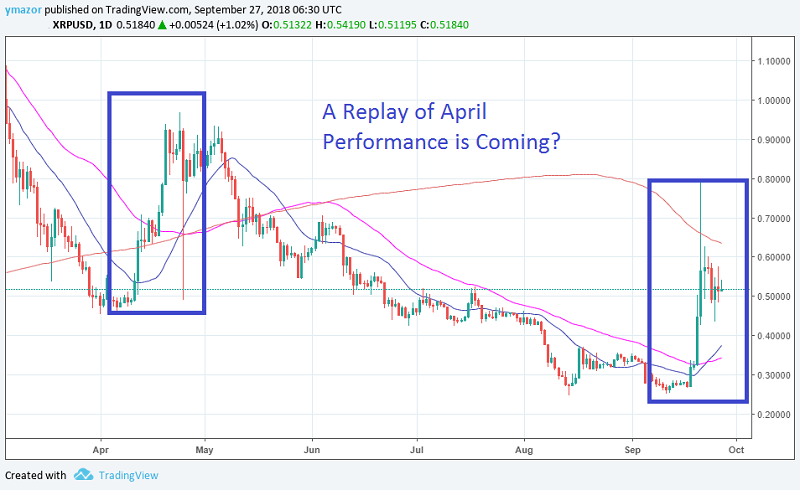
Support levels:
Weak: 0.450 Strong: 0.360 Key: 0. 246
Resistance levels:
Weak: 0.600 Strong: 0.700 Key: 0.900
Average prices:
Month: 0.375 Quarter: 0.344 Year: 0.635
*Any views and opinions presented in this section only reflect the author’s private opinion and should not be considered as guidance for trading.
This article was written by Yaron Mazor, a senior analyst at DX.Exchange
This article was originally posted on FX Empire
More From FXEMPIRE:
New Pressure Trigger: Hawkish Fed’s Stance; Global Stocks Decline After Fed Meeting
USD/CAD Daily Price Forecast – USD/CAD Scales 1.30 Handle on Fed Rate Hike Announcement
BTC/GBP: Two Major Players in the Financial Arena. Here’s How to Trade Them
Today’s Market Driver is Geopolitics, Fed is Already Old News
