
 Yahoo Finance
 Bitcoin, Bitcoin Cash, Ethereum, XRP and Litecoin Price Analysis
Bitcoin price analysis
Bitcoin (BTC/USD) is trading above its key mid and long-term support level. The downtrend will remain intact upon a break below the 5,800. On the upside, a break above 7,430 could indicate a direction change.
Support levels:
Week: 6,200
Strong: 6,000
Key: 5,800
Resistance levels:
Week: 6,600
Strong: 6,800
Key: 7,430
Average prices:
Month: 6,746
Quarter: 6,841
Year: 8,344
Bitcoin Cash price analysis
Bitcoin Cash (BCH/USD) is heading to its 2017 heavy trading activity levels between 400 and 350. Currently, the downside reigns.
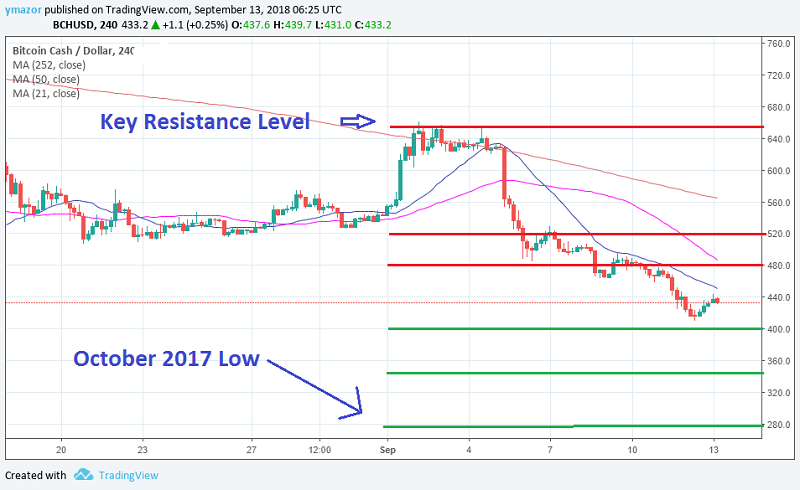
Support levels:
Week: 400
Strong: 350
Key: 280
Resistance levels:
Week: 460
Strong: 520
Key: 650
Average prices:
Month: 530.73
Quarter: 595.74
Year: 1,052.95
Ethereum price analysis
Ethereum (ETH/USD) has not been able to recover and keeps on digging new lows for the year. July 2017 low, around 136 is getting closer.
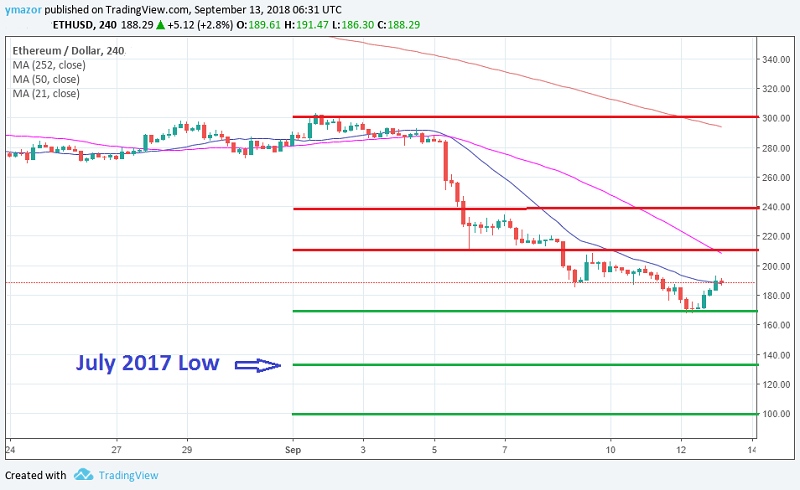
Support levels:
Week: 170
Strong: 136
Key: 100
Resistance levels:
Week: 210
Strong: 240
Key: 300
Average prices:
Month: 250.44
Quarter: 313.80
Year: 608.33
Litecoin price analysis
Litecoin (LTC/USD) is trying to hold water above the 50 mark, which serves as a short-term key support level. A break below the current support could ignite downward momentum towards the 2017 heavy trading activity region between 45 and 35.

Support levels:
Week: 45
Strong: 40
Key: 35
Resistance levels:
Week: 56
Strong: 64
Key: 70
Average prices:
Month: 58.85
Quarter: 61.47
Year: 129.41
XRP price analysis
XRP (XRP/USD) is trading around a significantly low-price level slightly above the 0.246, the year low. With no positive catalyst, the downtrend should remain in place.

Support levels:
Week: 0.246
Strong: 0.20
Key: 0.129
Resistance levels:
Week: 0.28
Strong: 0.31
Key: 0.36
Average prices:
Month: 0.311
Quarter: 0.345
Year: 0.721
*Any views and opinions presented in this section only reflect the author’s private opinion and should not be considered as guidance for trading.
This article was written by Yaron Mazor, a senior analyst at DX.Exchange
This article was originally posted on FX Empire
