
 Yahoo Finance
 Bitcoin (BTC) Fear & Greed Index Highlights Lingering Downside Risks
Key Insights:
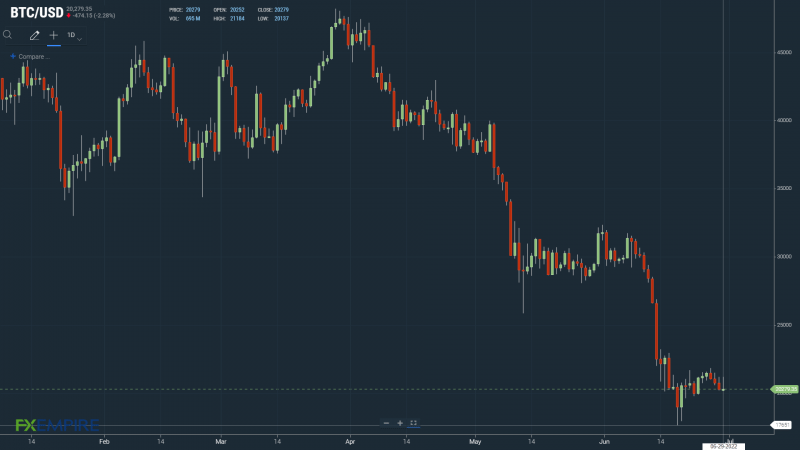
On Tuesday, bitcoin (BTC) fell by 2.25% to $20,252. It was a third consecutive day in the red.
Risk aversion swept the global financial markets early in the US session, sinking the NASDAQ and the broader crypto market.
Technical indicators are bearish, with bitcoin below the 50-day EMA.
On Tuesday, bitcoin (BTC) fell by 2.25%. Following a 1.49% decline on Monday, bitcoin ended the day at $20,252.
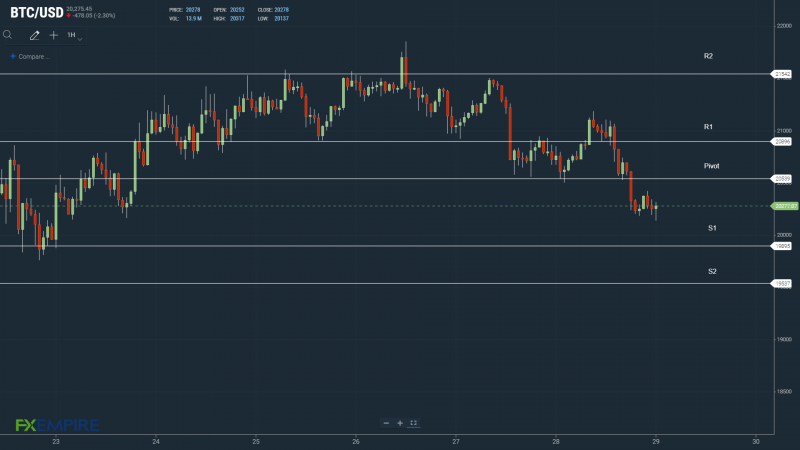
A bullish morning saw bitcoin rise to a high of $21,184 before hitting reverse. Falling short of the First Major Resistance Level at $21,298, bitcoin slid to a low of $20,180.
Bitcoin fell through the First Major Support Level at $20,346 to end the day at sub-$20,300.
On Tuesday. the correlation between bitcoin and the NASDAQ and the inverse correlation between bitcoin and WTI crude remained strong.
Risk aversion swept the global financial markets in response to US consumer confidence figures.
In June, the CB Consumer Confidence Index fell from 103.2 to 98.7. With the US economy hinged on consumption, the weaker consumer confidence figure reignited fears of an economic recession.
The NASDAQ 100 tumbled by 2.98%, with the Dow and the S&P500 falling by 1.56% and 2.01%, respectively.
Despite recession fears, WTI crude jumped by 2%, fueled by concerns over supply, adding to the market angst. Weak consumer confidence and upward pressure on inflation was a bad mix for riskier assets.

At the turn of the day, the NASDAQ 100 Mini was up 13.5 points.
Bitcoin Fear & Greed Index Delivers Modest Bitcoin Support
This morning, the Fear & Greed Index rose from 10/100 to 13/100. The increase was modest, with the Index continuing to move within a tight range in recent weeks.
While avoiding a return to sub-10/100 was positive, the Index highlighted lingering downside risks.
For the bitcoin bulls, avoiding sub-$20,000 suggested a possible bottoming out, supported by the recent Index moves.
However, the Index remains deep within the “Extreme Fear” zone, signaling investor fears of another material sell-off.
Investors will need to see an upward trend forming to suggest a possible return to the “Fear Zone,” last visited on May 5. On May 5, bitcoin stood at $36,630.

Bitcoin (BTC) Price Action
At the time of writing, BTC was up 0.10% to $20,279.
A mixed start to the day saw bitcoin fall to a low of $20,137 before rising to a high of $20,319.
BTC left the Support and Resistance Levels untested early on.
Technical Indicators
A BTC move through the $20,539 pivot would bring the First Major Resistance Level at $20,896 and the Tuesday high of $21,184 into play.
BTC would need plenty of support to return to $21,000.
An extended rally would test resistance at $21,500 and the Second Major Resistance Level at $21,542. The Third Major Resistance Level sits at $22,547.
Failure to move through the pivot would bring the First Major Support Level at $19,895 into play. Barring an extended sell-off, bitcoin should avoid sub-$19,500. The Second Major Support Level at $19,537 should limit the downside.
The Third Major Support Level sits at $18,531.
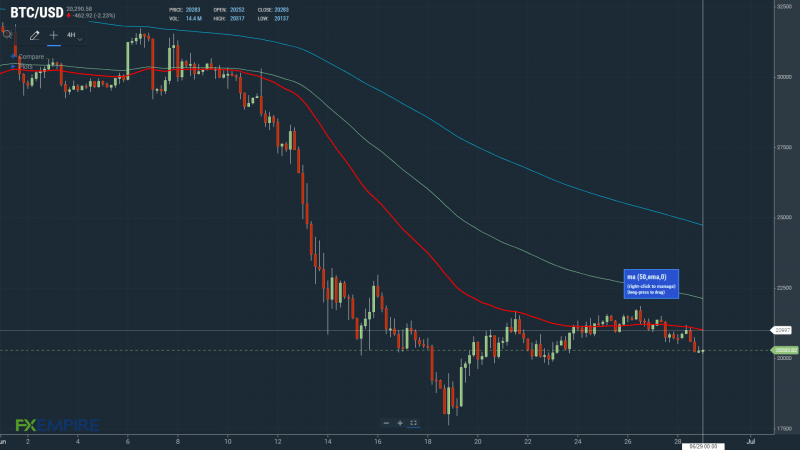
Looking at the EMAs and the 4-hourly candlestick chart (below), it was a bearish signal. This morning, bitcoin sat below the 50-day EMA, currently at $20,997.
The 50-day EMA fell back from the 100-day EMA. The 100-day EMA eased back from the 100-day EMA, bitcoin price negative.
A return to $22,000 would bring the 100-day EMA, currently at $22,111, and resistance at $22,500 in play.
However, failure to move through the 50-day EMA would leave the Major Support Levels into play.
This article was originally posted on FX Empire
More From FXEMPIRE:
Norway must prepare for faster drop in oil demand on road to 2050 – IEA
Japan’s Renesas, India’s Tata Motors partner to develop chip solutions
Tesla closes an office as layoff hits Autopilot jobs, including hourly ones
South Korea violated the rights of deported North Korean fishermen – U.N. investigator
Trump wanted to join Capitol riot, tried to grab limo steering wheel: aide
Dozens missing after strike on Ukraine mall, Russia presses attacks on east
