Bitcoin (BTC) Pumps and Reaches Local High Above $41,000
Bitcoin (BTC) continued its ongoing increase yesterday, creating another bullish candlestick.
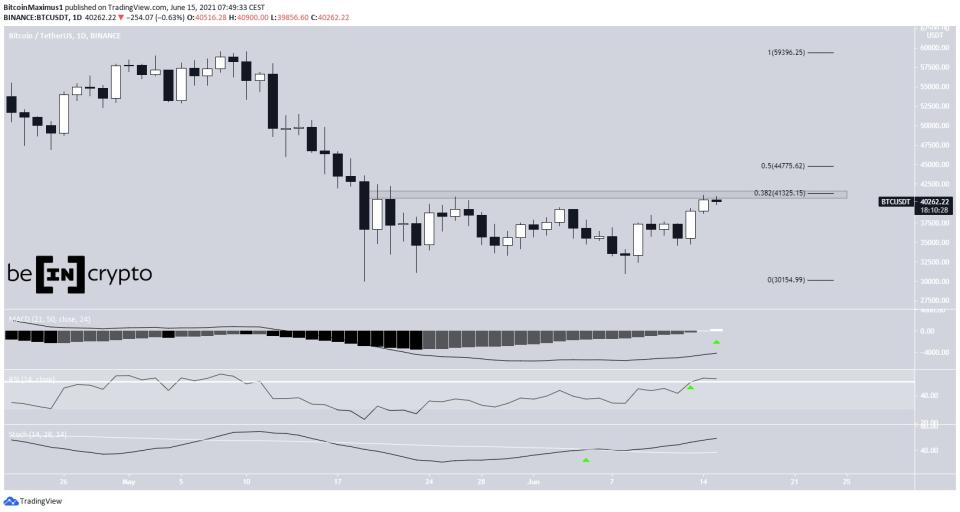
It has reached a horizontal and Fib resistance area near $41,325 which could cause a short-term rejection and pullback.
Ongoing BTC increase
The daily chart shows a bullish outlook for BTC. It followed up a bullish engulfing candlestick on June 13 with another smaller bullish candlestick the next day. So far, it has managed to reach a local high of $41,100.
When measuring the most recent portion of the decrease, the $41,125 area is the 0.382 Fib retracement level. In addition, it’s a horizontal resistance area, increasing its significance. The next resistance level is found at $44,775. This target is the 0.5 Fib retracement level.
Technical indicators are decisively bullish. The MACD is positive and the RSI has increased above the 50-line. Furthermore, the Stochastic oscillator has already made a bullish cross (green icon). All these signs indicate that an eventual breakout is likely.

However, the two-hour chart is showing weakness. The MACD has given a bearish reversal signal and the RSI has generated a bearish divergence. Both these signs suggest a short-term pullback is expected.
If so, the $38,000 area is both a horizontal support level and coincides with a potential ascending support line drawn from the June 8 lows. Therefore, it would be expected to provide support, potentially acting as the bottom for the pullback.

Wave count
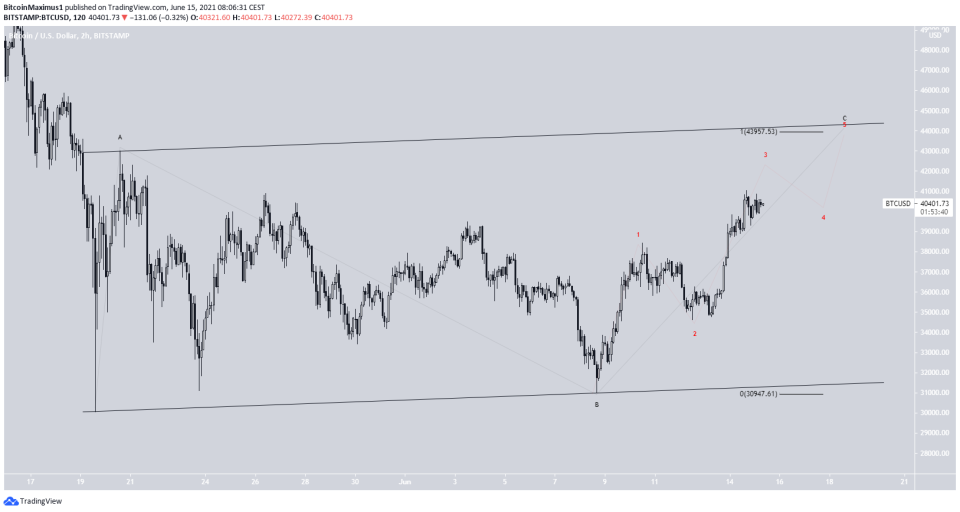
BTC has been trading inside an ascending parallel channel since May 19. It seems that the channel contains an A-B-C corrective structure.
A high of $43,950 would take the price all the way to the resistance line of the channel and would also give waves A:C a 1:1 ratio.
Therefore, it’s likely that a high will be reached close to that level. The move would also complete a longer-term fourth-wave pullback.

For BeInCrypto’s previous bitcoin (BTC) analysis, click here.

 Yahoo Finance