
 Yahoo Finance
 BNY Mellon (BK) Q1 Earnings Beat Estimates on Higher Revenues
Bank of New York Mellon Corporation’s BK first-quarter 2023 adjusted earnings of $1.13 per share surpassed the Zacks Consensus Estimate of $1.09. The bottom line reflects a rise of 20.2% from the prior-year quarter. Our estimate for earnings was 91 cents.
Results have been aided by a rise in net interest revenues and marginally higher fee revenues. However, the assets under management (AUM) balance witnessed a decline. Higher expenses and provisions hurt the results to some extent.
Net income applicable to common shareholders (GAAP basis) was $905 million or $1.12 per share, up from $699 million or 86 cents per share recorded in the year-ago quarter. Our estimate for net income was $645.9 million.
Revenues Improve, Expenses Rise
Total revenues increased 11.1% year over year to $4.36 billion. The top line marginally surpassed the Zacks Consensus Estimate of $4.35 billion. Our estimate for revenues was $4.16 billion.
Net interest revenues, on a fully taxable-equivalent (FTE) basis, were $1.13 billion, up 60.9% year over year. The rise reflected higher interest rates on interest-earning assets, partially offset by higher funding expenses.
The net interest margin (FTE basis) expanded 53 basis points (bps) year over year to 1.29%. Our estimate for NIM was 1.22%.
Total fee and other revenues increased marginally to $3.24 billion. The rise was driven by an increase in investment services fees, financing-related fees, distribution and servicing fees, and investment and other revenues. Our estimate for the same was $3.07 billion.
Total non-interest expenses (GAAP basis) were $3.10 billion, up 3.1% year over year. The rise was due to an increase in almost all cost components, except for net occupancy costs, sub-custodian and clearing costs, costs related to the amortization of intangible assets, and other expenses. Our estimate for expenses was $3.22 billion.
Asset Balances Mixed
As of Mar 31, 2023, AUM was $1.9 trillion, down 15.8% year over year. The decline was due to lower market values, the unfavorable impact of a stronger U.S. dollar and the divestiture of Alcentra, partially offset by net inflows. Our estimate for AUM was $1.99 trillion.
Assets under custody and/or administration of $46.6 trillion increased 2% year over year, primarily reflecting client inflows and net new business, partially offset by lower market values and the unfavorable impact of a stronger U.S. dollar.
Credit Quality: A Mixed Bag
Allowance for loan losses, as a percentage of total loans, was 0.27%, up 2 bps from the prior-year quarter. In the reported quarter, the company recorded a provision for credit losses of $27 million, up significantly from the $2 million reported in the year-ago quarter. We projected provisions of $20.5 million for the first quarter.
As of Mar 31, 2023, non-performing assets were $105 million, down 11.8% year over year.
Capital Position Improves
As of Mar 31, 2023, the common equity Tier 1 ratio was 11%, up from 10.1% as of the Mar 31, 2022 level. Tier 1 leverage ratio was 5.8%, up from 5.3% as of Mar 31, 2022.
Our Take
Higher interest rates, BNY Mellon’s global footprint and a strong balance sheet position are likely to keep supporting its revenue growth in the near term. However, concentration risk arising from significant dependence on fee-based revenues is a major concern.
The Bank of New York Mellon Corporation Price, Consensus and EPS Surprise
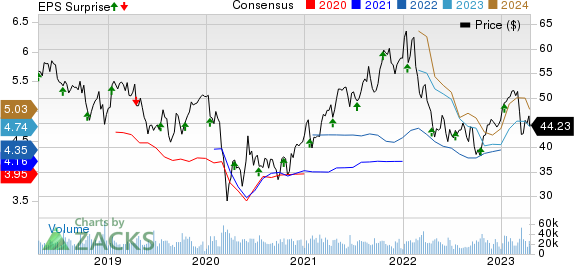
The Bank of New York Mellon Corporation price-consensus-eps-surprise-chart | The Bank of New York Mellon Corporation Quote
Currently, BNY Mellon carries a Zacks Rank #3 (Hold). You can see the complete list of today’s Zacks #1 Rank (Strong Buy) stocks here.
Performance of Other Banks
Wells Fargo’s WFC first-quarter 2023 earnings per share of $1.23 outpaced the Zacks Consensus Estimate of $1.15. The figure improved 35% year over year.
WFC’s results benefited from higher net interest income, rising rates and solid average loan growth. A fall in non-interest expenses acted as another tailwind. Yet, dismal non-interest income, higher provisions and weakness in the mortgage business were the major undermining factors for WFC.
Citigroup Inc.’s C first-quarter 2023 earnings per share (excluding divestiture-related impacts) of $1.86 outpaced the Zacks Consensus Estimate of $1.66. Our estimate for earnings was $1.40 per share.
Citigroup witnessed revenue growth in the quarter, backed by higher revenues in the Institutional Clients Group, and Personal Banking and Wealth Management segments. However, the higher cost of credit was a spoilsport.
Want the latest recommendations from Zacks Investment Research? Today, you can download 7 Best Stocks for the Next 30 Days. Click to get this free report
Wells Fargo & Company (WFC) : Free Stock Analysis Report
Citigroup Inc. (C) : Free Stock Analysis Report
The Bank of New York Mellon Corporation (BK) : Free Stock Analysis Report
