
 Yahoo Finance
 Burlington Stores (NYSE:BURL) Will Be Hoping To Turn Its Returns On Capital Around
What are the early trends we should look for to identify a stock that could multiply in value over the long term? Amongst other things, we'll want to see two things; firstly, a growing return on capital employed (ROCE) and secondly, an expansion in the company's amount of capital employed. If you see this, it typically means it's a company with a great business model and plenty of profitable reinvestment opportunities. In light of that, when we looked at Burlington Stores (NYSE:BURL) and its ROCE trend, we weren't exactly thrilled.
Understanding Return On Capital Employed (ROCE)
For those who don't know, ROCE is a measure of a company's yearly pre-tax profit (its return), relative to the capital employed in the business. The formula for this calculation on Burlington Stores is:
Return on Capital Employed = Earnings Before Interest and Tax (EBIT) ÷ (Total Assets - Current Liabilities)
0.12 = US$605m ÷ (US$6.9b - US$1.7b) (Based on the trailing twelve months to April 2022).
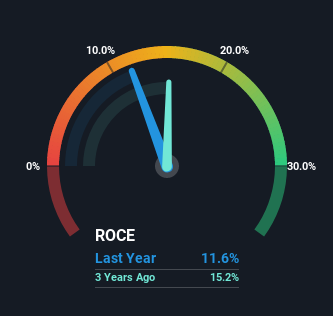
Therefore, Burlington Stores has an ROCE of 12%. In absolute terms, that's a pretty standard return but compared to the Specialty Retail industry average it falls behind.
Check out our latest analysis for Burlington Stores
In the above chart we have measured Burlington Stores' prior ROCE against its prior performance, but the future is arguably more important. If you'd like to see what analysts are forecasting going forward, you should check out our free report for Burlington Stores.
The Trend Of ROCE
On the surface, the trend of ROCE at Burlington Stores doesn't inspire confidence. To be more specific, ROCE has fallen from 25% over the last five years. Although, given both revenue and the amount of assets employed in the business have increased, it could suggest the company is investing in growth, and the extra capital has led to a short-term reduction in ROCE. If these investments prove successful, this can bode very well for long term stock performance.
On a related note, Burlington Stores has decreased its current liabilities to 25% of total assets. So we could link some of this to the decrease in ROCE. What's more, this can reduce some aspects of risk to the business because now the company's suppliers or short-term creditors are funding less of its operations. Since the business is basically funding more of its operations with it's own money, you could argue this has made the business less efficient at generating ROCE.
The Bottom Line On Burlington Stores' ROCE
In summary, despite lower returns in the short term, we're encouraged to see that Burlington Stores is reinvesting for growth and has higher sales as a result. And the stock has followed suit returning a meaningful 72% to shareholders over the last five years. So while the underlying trends could already be accounted for by investors, we still think this stock is worth looking into further.
If you want to continue researching Burlington Stores, you might be interested to know about the 3 warning signs that our analysis has discovered.
If you want to search for solid companies with great earnings, check out this free list of companies with good balance sheets and impressive returns on equity.
Have feedback on this article? Concerned about the content? Get in touch with us directly. Alternatively, email editorial-team (at) simplywallst.com.
This article by Simply Wall St is general in nature. We provide commentary based on historical data and analyst forecasts only using an unbiased methodology and our articles are not intended to be financial advice. It does not constitute a recommendation to buy or sell any stock, and does not take account of your objectives, or your financial situation. We aim to bring you long-term focused analysis driven by fundamental data. Note that our analysis may not factor in the latest price-sensitive company announcements or qualitative material. Simply Wall St has no position in any stocks mentioned.
