
 Yahoo Finance
 Calculating The Intrinsic Value Of NTG Clarity Networks Inc. (CVE:NCI)
Does the May share price for NTG Clarity Networks Inc. (CVE:NCI) reflect what it's really worth? Today, we will estimate the stock's intrinsic value by estimating the company's future cash flows and discounting them to their present value. We will take advantage of the Discounted Cash Flow (DCF) model for this purpose. Believe it or not, it's not too difficult to follow, as you'll see from our example!
We generally believe that a company's value is the present value of all of the cash it will generate in the future. However, a DCF is just one valuation metric among many, and it is not without flaws. If you want to learn more about discounted cash flow, the rationale behind this calculation can be read in detail in the Simply Wall St analysis model.
View our latest analysis for NTG Clarity Networks
Is NTG Clarity Networks fairly valued?
We're using the 2-stage growth model, which simply means we take in account two stages of company's growth. In the initial period the company may have a higher growth rate and the second stage is usually assumed to have a stable growth rate. To begin with, we have to get estimates of the next ten years of cash flows. Seeing as no analyst estimates of free cash flow are available to us, we have extrapolate the previous free cash flow (FCF) from the company's last reported value. We assume companies with shrinking free cash flow will slow their rate of shrinkage, and that companies with growing free cash flow will see their growth rate slow, over this period. We do this to reflect that growth tends to slow more in the early years than it does in later years.
Generally we assume that a dollar today is more valuable than a dollar in the future, so we need to discount the sum of these future cash flows to arrive at a present value estimate:
10-year free cash flow (FCF) estimate
2022 | 2023 | 2024 | 2025 | 2026 | 2027 | 2028 | 2029 | 2030 | 2031 | |
Levered FCF (CA$, Millions) | CA$599.2k | CA$566.8k | CA$548.0k | CA$537.8k | CA$533.3k | CA$532.7k | CA$534.8k | CA$538.7k | CA$544.0k | CA$550.3k |
Growth Rate Estimate Source | Est @ -8.4% | Est @ -5.41% | Est @ -3.32% | Est @ -1.86% | Est @ -0.83% | Est @ -0.11% | Est @ 0.39% | Est @ 0.74% | Est @ 0.99% | Est @ 1.16% |
Present Value (CA$, Millions) Discounted @ 9.0% | CA$0.5 | CA$0.5 | CA$0.4 | CA$0.4 | CA$0.3 | CA$0.3 | CA$0.3 | CA$0.3 | CA$0.3 | CA$0.2 |
("Est" = FCF growth rate estimated by Simply Wall St)
Present Value of 10-year Cash Flow (PVCF) = CA$3.0m
We now need to calculate the Terminal Value, which accounts for all the future cash flows after this ten year period. The Gordon Growth formula is used to calculate Terminal Value at a future annual growth rate equal to the 5-year average of the 10-year government bond yield of 1.6%. We discount the terminal cash flows to today's value at a cost of equity of 9.0%.
Terminal Value (TV)= FCF2031 × (1 + g) ÷ (r – g) = CA$550k× (1 + 1.6%) ÷ (9.0%– 1.6%) = CA$7.5m
Present Value of Terminal Value (PVTV)= TV / (1 + r)10= CA$7.5m÷ ( 1 + 9.0%)10= CA$3.2m
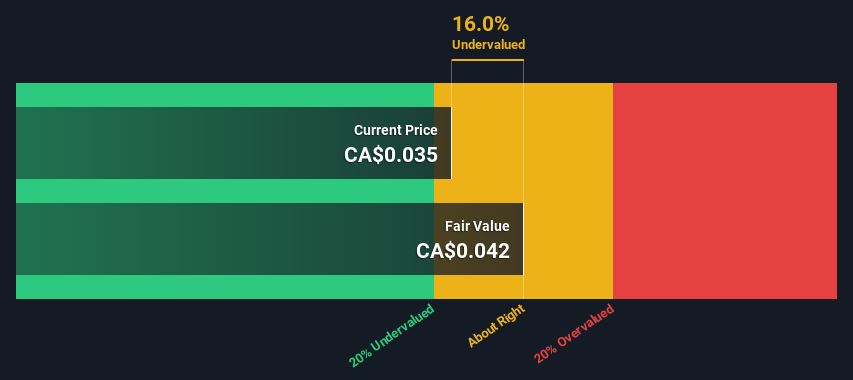
The total value is the sum of cash flows for the next ten years plus the discounted terminal value, which results in the Total Equity Value, which in this case is CA$6.2m. The last step is to then divide the equity value by the number of shares outstanding. Relative to the current share price of CA$0.04, the company appears about fair value at a 16% discount to where the stock price trades currently. The assumptions in any calculation have a big impact on the valuation, so it is better to view this as a rough estimate, not precise down to the last cent.
The assumptions
We would point out that the most important inputs to a discounted cash flow are the discount rate and of course the actual cash flows. You don't have to agree with these inputs, I recommend redoing the calculations yourself and playing with them. The DCF also does not consider the possible cyclicality of an industry, or a company's future capital requirements, so it does not give a full picture of a company's potential performance. Given that we are looking at NTG Clarity Networks as potential shareholders, the cost of equity is used as the discount rate, rather than the cost of capital (or weighted average cost of capital, WACC) which accounts for debt. In this calculation we've used 9.0%, which is based on a levered beta of 1.758. Beta is a measure of a stock's volatility, compared to the market as a whole. We get our beta from the industry average beta of globally comparable companies, with an imposed limit between 0.8 and 2.0, which is a reasonable range for a stable business.
Looking Ahead:
Valuation is only one side of the coin in terms of building your investment thesis, and it ideally won't be the sole piece of analysis you scrutinize for a company. DCF models are not the be-all and end-all of investment valuation. Preferably you'd apply different cases and assumptions and see how they would impact the company's valuation. For example, changes in the company's cost of equity or the risk free rate can significantly impact the valuation. For NTG Clarity Networks, there are three further items you should explore:
Risks: For example, we've discovered 5 warning signs for NTG Clarity Networks (2 are a bit unpleasant!) that you should be aware of before investing here.
Other High Quality Alternatives: Do you like a good all-rounder? Explore our interactive list of high quality stocks to get an idea of what else is out there you may be missing!
Other Environmentally-Friendly Companies: Concerned about the environment and think consumers will buy eco-friendly products more and more? Browse through our interactive list of companies that are thinking about a greener future to discover some stocks you may not have thought of!
PS. Simply Wall St updates its DCF calculation for every Canadian stock every day, so if you want to find the intrinsic value of any other stock just search here.
Have feedback on this article? Concerned about the content? Get in touch with us directly. Alternatively, email editorial-team (at) simplywallst.com.
This article by Simply Wall St is general in nature. We provide commentary based on historical data and analyst forecasts only using an unbiased methodology and our articles are not intended to be financial advice. It does not constitute a recommendation to buy or sell any stock, and does not take account of your objectives, or your financial situation. We aim to bring you long-term focused analysis driven by fundamental data. Note that our analysis may not factor in the latest price-sensitive company announcements or qualitative material. Simply Wall St has no position in any stocks mentioned.
