
 Yahoo Finance
 Calnex Solutions (LON:CLX) Could Become A Multi-Bagger
Finding a business that has the potential to grow substantially is not easy, but it is possible if we look at a few key financial metrics. In a perfect world, we'd like to see a company investing more capital into its business and ideally the returns earned from that capital are also increasing. This shows us that it's a compounding machine, able to continually reinvest its earnings back into the business and generate higher returns. And in light of that, the trends we're seeing at Calnex Solutions' (LON:CLX) look very promising so lets take a look.
Understanding Return On Capital Employed (ROCE)
If you haven't worked with ROCE before, it measures the 'return' (pre-tax profit) a company generates from capital employed in its business. The formula for this calculation on Calnex Solutions is:
Return on Capital Employed = Earnings Before Interest and Tax (EBIT) ÷ (Total Assets - Current Liabilities)
0.24 = UK£6.0m ÷ (UK£31m - UK£5.9m) (Based on the trailing twelve months to March 2022).
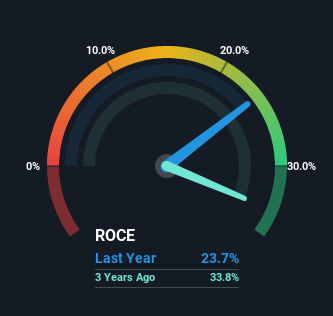
Thus, Calnex Solutions has an ROCE of 24%. In absolute terms that's a great return and it's even better than the Communications industry average of 10%.
View our latest analysis for Calnex Solutions
In the above chart we have measured Calnex Solutions' prior ROCE against its prior performance, but the future is arguably more important. If you'd like to see what analysts are forecasting going forward, you should check out our free report for Calnex Solutions.
How Are Returns Trending?
The trends we've noticed at Calnex Solutions are quite reassuring. The data shows that returns on capital have increased substantially over the last five years to 24%. Basically the business is earning more per dollar of capital invested and in addition to that, 433% more capital is being employed now too. This can indicate that there's plenty of opportunities to invest capital internally and at ever higher rates, a combination that's common among multi-baggers.
One more thing to note, Calnex Solutions has decreased current liabilities to 19% of total assets over this period, which effectively reduces the amount of funding from suppliers or short-term creditors. This tells us that Calnex Solutions has grown its returns without a reliance on increasing their current liabilities, which we're very happy with.
The Bottom Line
All in all, it's terrific to see that Calnex Solutions is reaping the rewards from prior investments and is growing its capital base. Since the stock has returned a solid 45% to shareholders over the last year, it's fair to say investors are beginning to recognize these changes. Therefore, we think it would be worth your time to check if these trends are going to continue.
If you want to know some of the risks facing Calnex Solutions we've found 2 warning signs (1 doesn't sit too well with us!) that you should be aware of before investing here.
If you want to search for more stocks that have been earning high returns, check out this free list of stocks with solid balance sheets that are also earning high returns on equity.
Have feedback on this article? Concerned about the content? Get in touch with us directly. Alternatively, email editorial-team (at) simplywallst.com.
This article by Simply Wall St is general in nature. We provide commentary based on historical data and analyst forecasts only using an unbiased methodology and our articles are not intended to be financial advice. It does not constitute a recommendation to buy or sell any stock, and does not take account of your objectives, or your financial situation. We aim to bring you long-term focused analysis driven by fundamental data. Note that our analysis may not factor in the latest price-sensitive company announcements or qualitative material. Simply Wall St has no position in any stocks mentioned.
Join A Paid User Research Session
You’ll receive a US$30 Amazon Gift card for 1 hour of your time while helping us build better investing tools for the individual investors like yourself. Sign up here
