
 Yahoo Finance
 Canadian Dollar Steady Ahead of GDP
USD/CAD
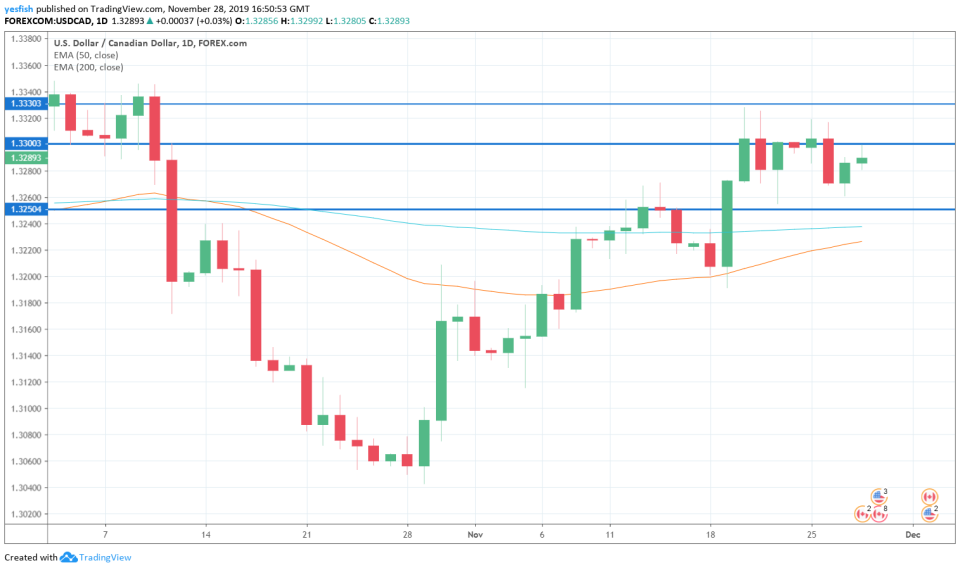
USD/CAD is showing little movement on Friday. In the European session, the pair is trading at 1.3288, up 0.06% on the day.
Canadian GDP – A Market Mover?
With an abbreviated trading day in the U.S., Canadian events will be in the spotlight on Friday. The key event is Canadian GDP, which is released on a monthly basis. GDP releases, which can be viewed as a report card for the economy, have been soft in recent months. This trend is expected to continue, with the estimate for September standing at 0.1%. An unexpected reading could shake up the sleepy Canadian dollar.
The economy is projected to slow to 1.3% in the third quarter, identical to the figure in the second quarter. The economy has been under pressure due to the ongoing global trade war, which has taken its toll on Canadian exports. Domestically, consumer spending has been restrained due to a high debt-to-income ratio. We’ll also get a look at the Raw Materials Price Index, which is projected to post a decline of 1.9% of October, after a reading of 0.0% in the previous release.
Technical Analysis
With USD/CAD showing little movement, our technical analysis remains in place. There is immediate resistance at 1.3300. This line was last tested on October 9th. If the pair can break above this line, it has room to climb all the way to 1.3385, which is the next line of resistance.
On the downside, there is support at 1.3250. The 200-EMA and 50-EMA lines follow closely – the 200-EMA is at 1.3238 and the 50-EMA follows at 1.3228. These two lines appear headed for a crossover – if the 50-EMA breaks above the 200-EMA, this would be a bullish signal for the pair.
EUR/GBP
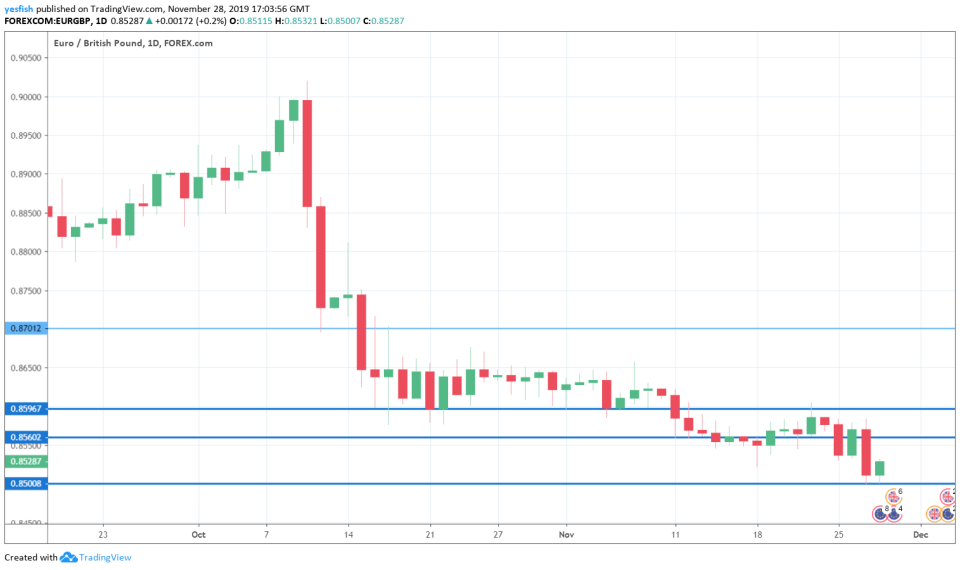
EUR/GBP is trading sideways on Friday. Currently, the pair is trading at 0.8534, up 0.07% on the day.
Technical Analysis
The pair continues to be stymied by resistance at 0.8560 line, which has remained relevant since mid-November. After losses on Wednesday, EUR/GBP is also putting pressure on 0.8500. This major support line has not been breached since the end of April, so a breakout would be a significant development. Above, we find resistance at 0.8590, followed by resistance at 0.8700.
This article was originally posted on FX Empire
