
 Yahoo Finance
 Capital Allocation Trends At Macquarie Telecom Group (ASX:MAQ) Aren't Ideal
If we want to find a stock that could multiply over the long term, what are the underlying trends we should look for? Typically, we'll want to notice a trend of growing return on capital employed (ROCE) and alongside that, an expanding base of capital employed. Put simply, these types of businesses are compounding machines, meaning they are continually reinvesting their earnings at ever-higher rates of return. In light of that, when we looked at Macquarie Telecom Group (ASX:MAQ) and its ROCE trend, we weren't exactly thrilled.
Return On Capital Employed (ROCE): What Is It?
If you haven't worked with ROCE before, it measures the 'return' (pre-tax profit) a company generates from capital employed in its business. To calculate this metric for Macquarie Telecom Group, this is the formula:
Return on Capital Employed = Earnings Before Interest and Tax (EBIT) ÷ (Total Assets - Current Liabilities)
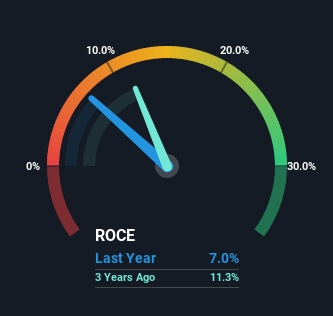
0.07 = AU$30m ÷ (AU$498m - AU$64m) (Based on the trailing twelve months to December 2022).
Thus, Macquarie Telecom Group has an ROCE of 7.0%. On its own, that's a low figure but it's around the 6.4% average generated by the Telecom industry.
View our latest analysis for Macquarie Telecom Group
Above you can see how the current ROCE for Macquarie Telecom Group compares to its prior returns on capital, but there's only so much you can tell from the past. If you'd like, you can check out the forecasts from the analysts covering Macquarie Telecom Group here for free.
What Does the ROCE Trend For Macquarie Telecom Group Tell Us?
In terms of Macquarie Telecom Group's historical ROCE movements, the trend isn't fantastic. Around five years ago the returns on capital were 23%, but since then they've fallen to 7.0%. However, given capital employed and revenue have both increased it appears that the business is currently pursuing growth, at the consequence of short term returns. And if the increased capital generates additional returns, the business, and thus shareholders, will benefit in the long run.
On a side note, Macquarie Telecom Group has done well to pay down its current liabilities to 13% of total assets. So we could link some of this to the decrease in ROCE. Effectively this means their suppliers or short-term creditors are funding less of the business, which reduces some elements of risk. Some would claim this reduces the business' efficiency at generating ROCE since it is now funding more of the operations with its own money.
The Bottom Line On Macquarie Telecom Group's ROCE
Even though returns on capital have fallen in the short term, we find it promising that revenue and capital employed have both increased for Macquarie Telecom Group. And the stock has done incredibly well with a 224% return over the last five years, so long term investors are no doubt ecstatic with that result. So should these growth trends continue, we'd be optimistic on the stock going forward.
One more thing, we've spotted 1 warning sign facing Macquarie Telecom Group that you might find interesting.
For those who like to invest in solid companies, check out this free list of companies with solid balance sheets and high returns on equity.
Have feedback on this article? Concerned about the content? Get in touch with us directly. Alternatively, email editorial-team (at) simplywallst.com.
This article by Simply Wall St is general in nature. We provide commentary based on historical data and analyst forecasts only using an unbiased methodology and our articles are not intended to be financial advice. It does not constitute a recommendation to buy or sell any stock, and does not take account of your objectives, or your financial situation. We aim to bring you long-term focused analysis driven by fundamental data. Note that our analysis may not factor in the latest price-sensitive company announcements or qualitative material. Simply Wall St has no position in any stocks mentioned.
Join A Paid User Research Session
You’ll receive a US$30 Amazon Gift card for 1 hour of your time while helping us build better investing tools for the individual investors like yourself. Sign up here
