
 Yahoo Finance
 Capital Allocation Trends At Severn Trent (LON:SVT) Aren't Ideal
Did you know there are some financial metrics that can provide clues of a potential multi-bagger? Amongst other things, we'll want to see two things; firstly, a growing return on capital employed (ROCE) and secondly, an expansion in the company's amount of capital employed. If you see this, it typically means it's a company with a great business model and plenty of profitable reinvestment opportunities. However, after briefly looking over the numbers, we don't think Severn Trent (LON:SVT) has the makings of a multi-bagger going forward, but let's have a look at why that may be.
Understanding Return On Capital Employed (ROCE)
Just to clarify if you're unsure, ROCE is a metric for evaluating how much pre-tax income (in percentage terms) a company earns on the capital invested in its business. The formula for this calculation on Severn Trent is:
Return on Capital Employed = Earnings Before Interest and Tax (EBIT) ÷ (Total Assets - Current Liabilities)
0.048 = UK£500m ÷ (UK£12b - UK£1.1b) (Based on the trailing twelve months to March 2022).
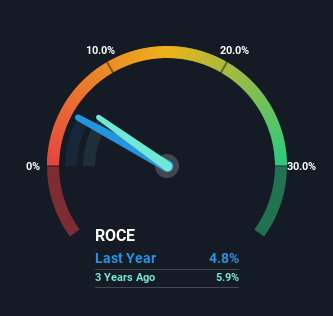
So, Severn Trent has an ROCE of 4.8%. Even though it's in line with the industry average of 4.8%, it's still a low return by itself.
Check out our latest analysis for Severn Trent
Above you can see how the current ROCE for Severn Trent compares to its prior returns on capital, but there's only so much you can tell from the past. If you'd like, you can check out the forecasts from the analysts covering Severn Trent here for free.
How Are Returns Trending?
In terms of Severn Trent's historical ROCE movements, the trend isn't fantastic. Around five years ago the returns on capital were 6.2%, but since then they've fallen to 4.8%. However it looks like Severn Trent might be reinvesting for long term growth because while capital employed has increased, the company's sales haven't changed much in the last 12 months. It may take some time before the company starts to see any change in earnings from these investments.
The Bottom Line On Severn Trent's ROCE
Bringing it all together, while we're somewhat encouraged by Severn Trent's reinvestment in its own business, we're aware that returns are shrinking. Although the market must be expecting these trends to improve because the stock has gained 64% over the last five years. Ultimately, if the underlying trends persist, we wouldn't hold our breath on it being a multi-bagger going forward.
On a separate note, we've found 2 warning signs for Severn Trent you'll probably want to know about.
For those who like to invest in solid companies, check out this free list of companies with solid balance sheets and high returns on equity.
Have feedback on this article? Concerned about the content? Get in touch with us directly. Alternatively, email editorial-team (at) simplywallst.com.
This article by Simply Wall St is general in nature. We provide commentary based on historical data and analyst forecasts only using an unbiased methodology and our articles are not intended to be financial advice. It does not constitute a recommendation to buy or sell any stock, and does not take account of your objectives, or your financial situation. We aim to bring you long-term focused analysis driven by fundamental data. Note that our analysis may not factor in the latest price-sensitive company announcements or qualitative material. Simply Wall St has no position in any stocks mentioned.
Join A Paid User Research Session
You’ll receive a US$30 Amazon Gift card for 1 hour of your time while helping us build better investing tools for the individual investors like yourself. Sign up here
