
 Yahoo Finance
 Capri Holdings (NYSE:CPRI) Will Want To Turn Around Its Return Trends
If we want to find a potential multi-bagger, often there are underlying trends that can provide clues. Amongst other things, we'll want to see two things; firstly, a growing return on capital employed (ROCE) and secondly, an expansion in the company's amount of capital employed. Ultimately, this demonstrates that it's a business that is reinvesting profits at increasing rates of return. Although, when we looked at Capri Holdings (NYSE:CPRI), it didn't seem to tick all of these boxes.
Understanding Return On Capital Employed (ROCE)
For those who don't know, ROCE is a measure of a company's yearly pre-tax profit (its return), relative to the capital employed in the business. To calculate this metric for Capri Holdings, this is the formula:
Return on Capital Employed = Earnings Before Interest and Tax (EBIT) ÷ (Total Assets - Current Liabilities)
0.17 = US$1.0b ÷ (US$7.2b - US$1.3b) (Based on the trailing twelve months to October 2022).
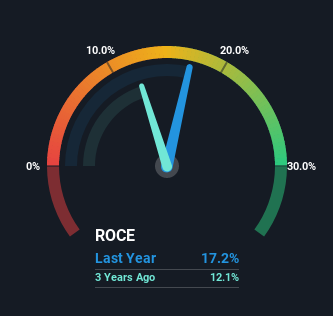
Therefore, Capri Holdings has an ROCE of 17%. By itself that's a normal return on capital and it's in line with the industry's average returns of 17%.
See our latest analysis for Capri Holdings
Above you can see how the current ROCE for Capri Holdings compares to its prior returns on capital, but there's only so much you can tell from the past. If you'd like, you can check out the forecasts from the analysts covering Capri Holdings here for free.
The Trend Of ROCE
In terms of Capri Holdings' historical ROCE movements, the trend isn't fantastic. Over the last five years, returns on capital have decreased to 17% from 42% five years ago. However, given capital employed and revenue have both increased it appears that the business is currently pursuing growth, at the consequence of short term returns. If these investments prove successful, this can bode very well for long term stock performance.
Our Take On Capri Holdings' ROCE
Even though returns on capital have fallen in the short term, we find it promising that revenue and capital employed have both increased for Capri Holdings. However, total returns to shareholders over the last five years have been flat, which could indicate these growth trends potentially aren't accounted for yet by investors. As a result, we'd recommend researching this stock further to uncover what other fundamentals of the business can show us.
Like most companies, Capri Holdings does come with some risks, and we've found 1 warning sign that you should be aware of.
While Capri Holdings may not currently earn the highest returns, we've compiled a list of companies that currently earn more than 25% return on equity. Check out this free list here.
Have feedback on this article? Concerned about the content? Get in touch with us directly. Alternatively, email editorial-team (at) simplywallst.com.
This article by Simply Wall St is general in nature. We provide commentary based on historical data and analyst forecasts only using an unbiased methodology and our articles are not intended to be financial advice. It does not constitute a recommendation to buy or sell any stock, and does not take account of your objectives, or your financial situation. We aim to bring you long-term focused analysis driven by fundamental data. Note that our analysis may not factor in the latest price-sensitive company announcements or qualitative material. Simply Wall St has no position in any stocks mentioned.
Join A Paid User Research Session
You’ll receive a US$30 Amazon Gift card for 1 hour of your time while helping us build better investing tools for the individual investors like yourself. Sign up here
