
 Yahoo Finance
 Castlight (CSLT) Reports In-Line Loss in Q4, Issues '18 View

Castlight Health Inc. CSLT reported fourth-quarter 2017 loss of 4 cents per share, in line with the Zacks Consensus Estimate and narrower than year-ago quarter figure of 5 cents per share.
Revenues surged 23.8% year over year to $37 million. Subscription revenues (90.6% of total revenues) increased 19.1% to $33.5 million. Professional services & other (9.4% of total revenues) doubled year over year to almost $3.5 million.
Operating Details
Non-GAAP gross margin contracted 710 basis points (bps) from the year-ago quarter to 67.7%. Subscription gross margin contracted 980 bps, partially offset by 280 bps expansion in professional services & other gross margin.
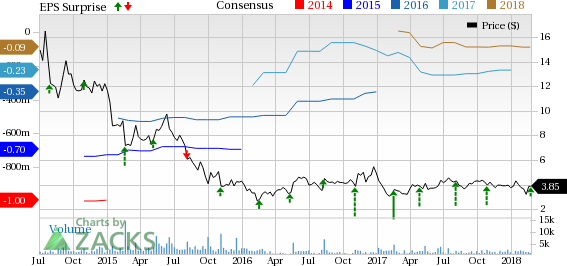
Castlight Health, inc. Price, Consensus and EPS Surprise
Castlight Health, inc. Price, Consensus and EPS Surprise | Castlight Health, inc. Quote
Non-GAAP sales & marketing expenses as percentage of revenues declined 440 bps to 34.8% in the quarter. However, non-GAAP research & development expenses and general & administrative expenses expanded 690 bps and 100 bps, respectively, to 34.3% and 14.2%.
The company continues to invest heavily on research & development, particularly on the upcoming consolidated platform that will include Castlight and legacy Jiff products, as well as Anthem Engage. The company expects to launch the platform in late third-quarter or early fourth-quarter.
Castlight reported non-GAAP operating loss of $5.8 million in the quarter.
2017 at a Glance
Non-GAAP net loss was 22 cents per share, narrower than loss of 30 cents per share delivered in 2016.
Revenues increased 29% to $131.4 million. The company ended 2017 with $163 million in annualized recurring revenue (“ARR”) compared with $122 million in 2016. On a pro forma basis, Castlight's ARR growth rate was 17% in 2017, significantly up from 11% in 2016.
The company’s business mix improved significantly in 2017. Transparency clients accounted for 21% of total ARR in 2017 as compared with more than 50% at the end of 2016. Net dollar retention was 104% in 2017.
Castlight’s care guidance and wellbeing offerings had more than 50 customers at the end of 2017.
Guidance
For 2018, the company forecasts revenues between $150 million and $155 million. Management expects the first half contribution to revenues to be in the high 40% range with the remainder in the second half of the year.
Non-GAAP operating loss is expected in the range of $15-$20 million. Non-GAAP loss is expected between 11 cents and 15 cents per share.
Castlight anticipates first-quarter 2018 revenues to decline by about $1 million sequentially. Moreover, gross margin is expected to contract sequentially as company’s investments increases. Operating loss is projected to increase due to revenue seasonality.
Management expects to report break-even in fourth-quarter of 2018. ARR is anticipated to hit $170 million by the end of this year. The company’s higher level of investments on research & development is expected to continue, as it focuses on expanding offerings globally.
Moreover, adoption of ASC 606 is anticipated to negatively impact revenues in 2018. The company also expects cost of revenues and operating expense to be slightly lower in the year owing to adoption of the accounting standard.
Additionally, Castlight stated that it remains on track to be breakeven on the cash flow basis from operations in the fourth quarter. The company now expects to have at least $65 million of cash on hand by the end of 2018.
Zacks Rank and Stocks to Consider
Castlight carries a Zacks Rank #3 (Hold).
Paycom Software PAYC, Facebook FB and The Trade Desk TTD are some better-ranked stocks worth considering in the broader technology sector. While Paycom and Facebook sport a Zacks Rank #1 (Strong Buy), The Trade Desk carries a Zacks Rank #2 (Buy). You can see the complete list of today’s Zacks #1 Rank stocks here.
Long-term earnings growth rate for Paycom, Facebook and The Trade Desk are currently pegged at 25.75%, 26.51% and 25%, respectively.
More Stock News: This Is Bigger than the iPhone!
It could become the mother of all technological revolutions. Apple sold a mere 1 billion iPhones in 10 years but a new breakthrough is expected to generate more than 27 billion devices in just 3 years, creating a $1.7 trillion market.
Zacks has just released a Special Report that spotlights this fast-emerging phenomenon and 6 tickers for taking advantage of it. If you don't buy now, you may kick yourself in 2020.
Click here for the 6 trades >>
Want the latest recommendations from Zacks Investment Research? Today, you can download 7 Best Stocks for the Next 30 Days. Click to get this free report
Facebook, Inc. (FB) : Free Stock Analysis Report
The Trade Desk Inc. (TTD) : Free Stock Analysis Report
Paycom Software, Inc. (PAYC) : Free Stock Analysis Report
Castlight Health, inc. (CSLT) : Free Stock Analysis Report
To read this article on Zacks.com click here.
Zacks Investment Research
