
 Yahoo Finance
 Cellebrite DI (NASDAQ:CLBT) shareholders have endured a 46% loss from investing in the stock a year ago
The simplest way to benefit from a rising market is to buy an index fund. But if you buy individual stocks, you can do both better or worse than that. Investors in Cellebrite DI Ltd. (NASDAQ:CLBT) have tasted that bitter downside in the last year, as the share price dropped 46%. That contrasts poorly with the market decline of 7.6%. Because Cellebrite DI hasn't been listed for many years, the market is still learning about how the business performs. Unfortunately the share price momentum is still quite negative, with prices down 18% in thirty days. However, we note the price may have been impacted by the broader market, which is down 10% in the same time period.
With that in mind, it's worth seeing if the company's underlying fundamentals have been the driver of long term performance, or if there are some discrepancies.
See our latest analysis for Cellebrite DI
While the efficient markets hypothesis continues to be taught by some, it has been proven that markets are over-reactive dynamic systems, and investors are not always rational. One flawed but reasonable way to assess how sentiment around a company has changed is to compare the earnings per share (EPS) with the share price.
Cellebrite DI managed to increase earnings per share from a loss to a profit, over the last 12 months.
When a company has just transitioned to profitability, earnings per share growth is not always the best way to look at the share price action. So it makes sense to check out some other factors.
Cellebrite DI's revenue is actually up 26% over the last year. Since the fundamental metrics don't readily explain the share price drop, there might be an opportunity if the market has overreacted.
The graphic below depicts how earnings and revenue have changed over time (unveil the exact values by clicking on the image).
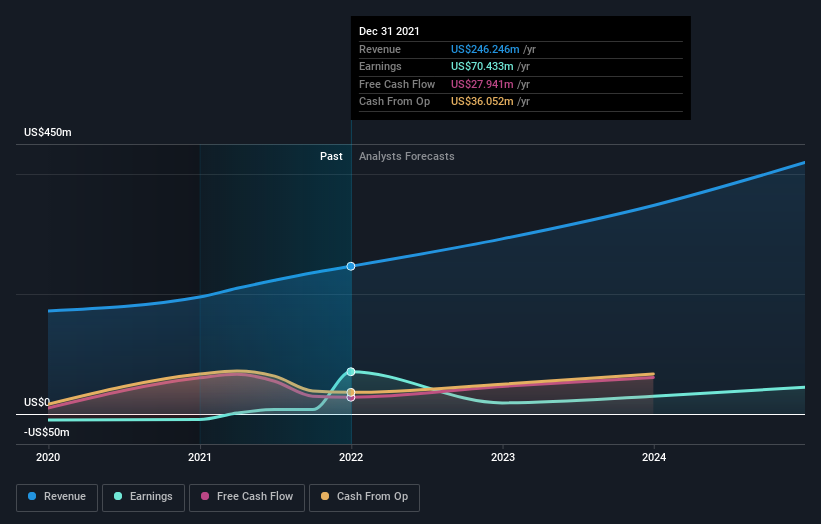
We like that insiders have been buying shares in the last twelve months. Having said that, most people consider earnings and revenue growth trends to be a more meaningful guide to the business. You can see what analysts are predicting for Cellebrite DI in this interactive graph of future profit estimates.
A Different Perspective
We doubt Cellebrite DI shareholders are happy with the loss of 46% over twelve months. That falls short of the market, which lost 7.6%. There's no doubt that's a disappointment, but the stock may well have fared better in a stronger market. The share price decline has continued throughout the most recent three months, down 11%, suggesting an absence of enthusiasm from investors. Basically, most investors should be wary of buying into a poor-performing stock, unless the business itself has clearly improved. It's always interesting to track share price performance over the longer term. But to understand Cellebrite DI better, we need to consider many other factors. For instance, we've identified 3 warning signs for Cellebrite DI (1 is significant) that you should be aware of.
There are plenty of other companies that have insiders buying up shares. You probably do not want to miss this free list of growing companies that insiders are buying.
Please note, the market returns quoted in this article reflect the market weighted average returns of stocks that currently trade on US exchanges.
Have feedback on this article? Concerned about the content? Get in touch with us directly. Alternatively, email editorial-team (at) simplywallst.com.
This article by Simply Wall St is general in nature. We provide commentary based on historical data and analyst forecasts only using an unbiased methodology and our articles are not intended to be financial advice. It does not constitute a recommendation to buy or sell any stock, and does not take account of your objectives, or your financial situation. We aim to bring you long-term focused analysis driven by fundamental data. Note that our analysis may not factor in the latest price-sensitive company announcements or qualitative material. Simply Wall St has no position in any stocks mentioned.
