
 Yahoo Finance
 Cenovus (CVE) Shares Decline 4.6% Despite Q1 Earnings Beat
Cenovus Energy Inc. CVE shares declined 4.6% after reporting better-than-expected first-quarter 2023 earnings on Apr 26. The downward price movement can be attributed to the company’s unsatisfactory quarterly upstream production and downgraded guidance.
Q1 Results
Cenovus reported first-quarter earnings per share of 24 cents, beating the Zacks Consensus Estimate of earnings of 22 cents. However, the bottom line declined from the year-ago quarter’s earnings of 62 cents per share.
Total quarterly revenues of $9,069 million missed the Zacks Consensus Estimate of $9,633 million. The top line significantly declined from the year-ago quarter’s $14,178 million.
Better-than-expected quarterly earnings can be primarily attributed to higher contributions from the Canadian Manufacturing unit and lower expenses for purchased products. The positives were partially offset by lower contributions from the upstream segment.
Cenovus Energy Inc Price, Consensus and EPS Surprise
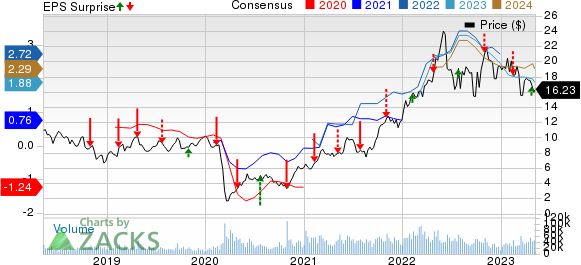
Cenovus Energy Inc price-consensus-eps-surprise-chart | Cenovus Energy Inc Quote
Operational Performance
Upstream
The quarterly operating margin from the Oil Sands unit was C$1,150 million, declining from C$2,199 million reported a year ago.
In the March-end quarter, the company recorded daily oil sand production of 587.5 thousand barrels, down 1.3% year over year due to lower contribution from its Foster Creek and Christina Lake operations.
The operating margin at the Conventional unit was C$261 million, down from C$263 million in the year-ago quarter. In the first quarter, the company recorded daily liquid production of 28.4 thousand barrels, down 13.2% year over year.
The Offshore segment generated an operating margin of C$300 million, down from C$458 million in the year-ago quarter. In the reported quarter, the company recorded daily offshore liquid production of 20.3 thousand barrels.
Downstream
From the Canadian Manufacturing unit, the company reported an operating margin of C$263 million, up from C$121 million in the year-ago quarter. The company recorded Crude Oil processed volumes of 98.7 thousand barrels per day (MBbl/D).
The operating margin from the U.S. Manufacturing unit was C$128 million, down from the year-ago quarter’s C$423 million. Crude oil processed volumes were 359.2 MBbl/D, signifying a decline from 403.7 MBbl/D in the year-ago quarter.
Expenses
Transportation and blending expenses in the reported quarter declined to C$2,853 million from C$2,973 million a year ago. Also, expenses for purchased products declined to C$5,792 million from C$7,484 million in the prior-year quarter.
Capital Investment & Balance Sheet
The company made a total capital investment of C$1,101 million in the quarter under review.
As of Mar 31, 2023, the Canada-based energy player had cash and cash equivalents of C$2,049 million. Total long-term debt was C$8,681 million. Its total debt-to-capitalization was 23.7%.
Outlook
For 2023, Cenovus expects upstream production of 790,000-810,000 barrels of oil-equivalent per day (Boe/d), indicating a decline from the prior-mentioned 800,000-840,000 Boe/d. CVE expects daily oil sand production of 582-642 thousand barrels for the year.
Cenovus expects a downstream throughput volume of 580,000-610,000 barrels per day for 2023.
The Zacks Rank #3 (Hold) company gave its total capital expenditure guidance of $4-$4.5 billion for the year. You can see the complete list of today’s Zacks #1 Rank (Strong Buy) stocks here.
Earnings Snapshots of Other Integrated Energy Companies
Exxon Mobil Corporation's XOM first-quarter 2023 earnings per share of $2.83 (excluding identified items) beat the Zacks Consensus Estimate of $2.65.
At the end of first-quarter 2023, ExxonMobil’s total cash and cash equivalents were $32,651 million, and long-term debt amounted to $39,150 million. The firm has significantly lower debt exposure as compared to other integrated majors. Also, ExxonMobil announced the expansion of its share repurchase program up to $50 billion through 2024.
TotalEnergies SE TTE reported first-quarter 2023 operating earnings of $2.61 (€2.43) per share, beating the Zacks Consensus Estimate of $2.43 per share.
TotalEnergies expects to invest $16 billion in 2023, of which $5 billion will be allocated to further strengthening renewable operations and electricity. TTE aims to repurchase stocks worth $2 billion in the second quarter, which will further boost shareholders’ value.
Chevron Corporation CVX reported adjusted first-quarter 2023 earnings per share of $3.55, surpassing the Zacks Consensus Estimate of $3.36 per share.
As of Dec 31, the San Ramon, CA-based company had $15.7 billion in cash and cash equivalents, and a total debt of $23.2 billion, with a debt-to-total capitalization of 12.7%. Compared with composite stocks belonging to the industry, Chevron has significantly lower exposure to debt capital.
Want the latest recommendations from Zacks Investment Research? Today, you can download 7 Best Stocks for the Next 30 Days. Click to get this free report
Chevron Corporation (CVX) : Free Stock Analysis Report
Exxon Mobil Corporation (XOM) : Free Stock Analysis Report
Cenovus Energy Inc (CVE) : Free Stock Analysis Report
TotalEnergies SE Sponsored ADR (TTE) : Free Stock Analysis Report
