
 Yahoo Finance
 CF Bankshares' (NASDAQ:CFBK) investors will be pleased with their favorable 91% return over the last three years
One simple way to benefit from the stock market is to buy an index fund. But if you pick the right individual stocks, you could make more than that. For example, CF Bankshares Inc. (NASDAQ:CFBK) shareholders have seen the share price rise 87% over three years, well in excess of the market return (60%, not including dividends).
So let's investigate and see if the longer term performance of the company has been in line with the underlying business' progress.
Check out our latest analysis for CF Bankshares
There is no denying that markets are sometimes efficient, but prices do not always reflect underlying business performance. By comparing earnings per share (EPS) and share price changes over time, we can get a feel for how investor attitudes to a company have morphed over time.
During three years of share price growth, CF Bankshares achieved compound earnings per share growth of 11% per year. In comparison, the 23% per year gain in the share price outpaces the EPS growth. This suggests that, as the business progressed over the last few years, it gained the confidence of market participants. It is quite common to see investors become enamoured with a business, after a few years of solid progress.
The company's earnings per share (over time) is depicted in the image below (click to see the exact numbers).
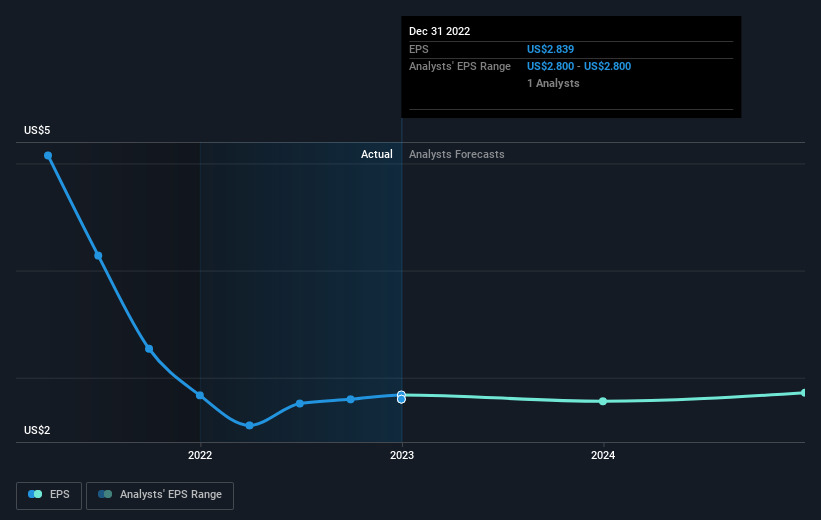
Dive deeper into CF Bankshares' key metrics by checking this interactive graph of CF Bankshares's earnings, revenue and cash flow.
What About Dividends?
It is important to consider the total shareholder return, as well as the share price return, for any given stock. The TSR incorporates the value of any spin-offs or discounted capital raisings, along with any dividends, based on the assumption that the dividends are reinvested. So for companies that pay a generous dividend, the TSR is often a lot higher than the share price return. We note that for CF Bankshares the TSR over the last 3 years was 91%, which is better than the share price return mentioned above. The dividends paid by the company have thusly boosted the total shareholder return.
A Different Perspective
While it's never nice to take a loss, CF Bankshares shareholders can take comfort that , including dividends,their trailing twelve month loss of 7.0% wasn't as bad as the market loss of around 12%. Longer term investors wouldn't be so upset, since they would have made 11%, each year, over five years. In the best case scenario the last year is just a temporary blip on the journey to a brighter future. Most investors take the time to check the data on insider transactions. You can click here to see if insiders have been buying or selling.
We will like CF Bankshares better if we see some big insider buys. While we wait, check out this free list of growing companies with considerable, recent, insider buying.
Please note, the market returns quoted in this article reflect the market weighted average returns of stocks that currently trade on American exchanges.
Have feedback on this article? Concerned about the content? Get in touch with us directly. Alternatively, email editorial-team (at) simplywallst.com.
This article by Simply Wall St is general in nature. We provide commentary based on historical data and analyst forecasts only using an unbiased methodology and our articles are not intended to be financial advice. It does not constitute a recommendation to buy or sell any stock, and does not take account of your objectives, or your financial situation. We aim to bring you long-term focused analysis driven by fundamental data. Note that our analysis may not factor in the latest price-sensitive company announcements or qualitative material. Simply Wall St has no position in any stocks mentioned.
Join A Paid User Research Session
You’ll receive a US$30 Amazon Gift card for 1 hour of your time while helping us build better investing tools for the individual investors like yourself. Sign up here
