
 Yahoo Finance
 Is The Coca-Cola Company’s (NYSE:KO) Balance Sheet A Threat To Its Future?

There are a number of reasons that attract investors towards large-cap companies such as The Coca-Cola Company (NYSE:KO), with a market cap of US$188.00B. Doing business globally, large caps tend to have diversified revenue streams and attractive capital returns, making them desirable investments for risk-averse portfolios. But, the key to their continued success lies in its financial health. Today we will look at Coca-Cola’s financial liquidity and debt levels, which are strong indicators for whether the company can weather economic downturns or fund strategic acquisitions for future growth. Remember this is a very top-level look that focuses exclusively on financial health, so I recommend a deeper analysis into KO here. Check out our latest analysis for Coca-Cola
How does KO’s operating cash flow stack up against its debt?
KO has sustained its debt level by about US$47.75B over the last 12 months comprising of short- and long-term debt. At this constant level of debt, the current cash and short-term investment levels stands at US$20.68B , ready to deploy into the business. On top of this, KO has produced cash from operations of US$7.11B over the same time period, leading to an operating cash to total debt ratio of 14.88%, indicating that KO’s debt is not appropriately covered by operating cash. This ratio can also be interpreted as a measure of efficiency as an alternative to return on assets. In KO’s case, it is able to generate 0.15x cash from its debt capital.
Does KO’s liquid assets cover its short-term commitments?
At the current liabilities level of US$27.19B liabilities, it seems that the business has been able to meet these obligations given the level of current assets of US$36.55B, with a current ratio of 1.34x. For Beverage companies, this ratio is within a sensible range since there’s sufficient cash cushion without leaving too much capital idle or in low-earning investments.
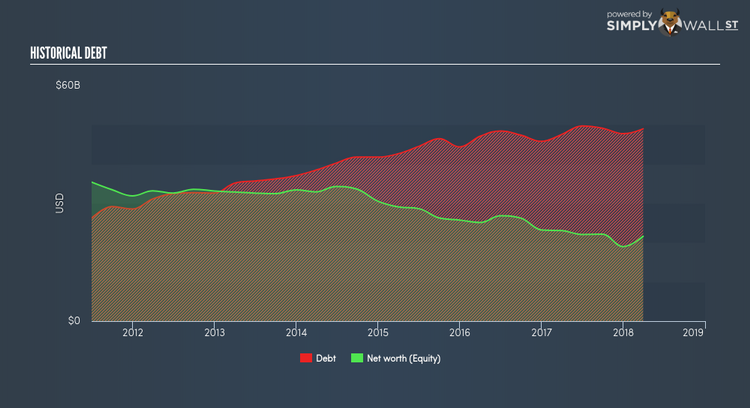
Can KO service its debt comfortably?
Since equity is smaller than total debt levels, Coca-Cola is considered to have high leverage. This isn’t surprising for large-caps, as equity can often be more expensive to issue than debt, plus interest payments are tax deductible. Accordingly, large companies often have lower cost of capital due to easily obtained financing, providing an advantage over smaller companies. The sustainability of KO’s debt levels can be assessed by comparing the company’s interest payments to earnings. Preferably, earnings before interest and tax (EBIT) should be at least three times as large as net interest. In KO’s case, the ratio of 83.67x suggests that interest is comfortably covered. High interest coverage is seen as a responsible and safe practice, which highlights why most investors believe large-caps such as KO is a safe investment.
Next Steps:
At its current level of cash flow coverage, KO has room for improvement to better cushion for events which may require debt repayment. Though, the company exhibits an ability to meet its near-term obligations, which isn’t a big surprise for a large-cap. Keep in mind I haven’t considered other factors such as how KO has been performing in the past. I recommend you continue to research Coca-Cola to get a better picture of the stock by looking at:
Future Outlook: What are well-informed industry analysts predicting for KO’s future growth? Take a look at our free research report of analyst consensus for KO’s outlook.
Valuation: What is KO worth today? Is the stock undervalued, even when its growth outlook is factored into its intrinsic value? The intrinsic value infographic in our free research report helps visualize whether KO is currently mispriced by the market.
Other High-Performing Stocks: Are there other stocks that provide better prospects with proven track records? Explore our free list of these great stocks here.
To help readers see pass the short term volatility of the financial market, we aim to bring you a long-term focused research analysis purely driven by fundamental data. Note that our analysis does not factor in the latest price sensitive company announcements.
The author is an independent contributor and at the time of publication had no position in the stocks mentioned.
