
 Yahoo Finance
 Is The Coca-Cola Company's (NYSE:KO) 2.9% Dividend Sustainable?

Dividend paying stocks like The Coca-Cola Company (NYSE:KO) tend to be popular with investors, and for good reason - some research suggests a significant amount of all stock market returns come from reinvested dividends. Yet sometimes, investors buy a popular dividend stock because of its yield, and then lose money if the company's dividend doesn't live up to expectations.
A slim 2.9% yield is hard to get excited about, but the long payment history is respectable. At the right price, or with strong growth opportunities, Coca-Cola could have potential. Some simple analysis can reduce the risk of holding Coca-Cola for its dividend, and we'll focus on the most important aspects below.
Explore this interactive chart for our latest analysis on Coca-Cola!
Payout ratios
Dividends are usually paid out of company earnings. If a company is paying more than it earns, then the dividend might become unsustainable - hardly an ideal situation. So we need to form a view on if a company's dividend is sustainable, relative to its net profit after tax. In the last year, Coca-Cola paid out 85% of its profit as dividends. It's paying out most of its earnings, which limits the amount that can be reinvested in the business. This may indicate limited need for further capital within the business, or highlight a commitment to paying a dividend.
In addition to comparing dividends against profits, we should inspect whether the company generated enough cash to pay its dividend. Coca-Cola paid out 82% of its cash flow last year. This may be sustainable but it does not leave much of a buffer for unexpected circumstances. It's encouraging to see that the dividend is covered by both profit and cash flow. This generally suggests the dividend is sustainable, as long as earnings don't drop precipitously.
Is Coca-Cola's Balance Sheet Risky?
As Coca-Cola has a meaningful amount of debt, we need to check its balance sheet to see if the company might have debt risks. A quick check of its financial situation can be done with two ratios: net debt divided by EBITDA (earnings before interest, tax, depreciation and amortisation), and net interest cover. Net debt to EBITDA is a measure of a company's total debt. Net interest cover measures the ability to meet interest payments. Essentially we check that a) the company does not have too much debt, and b) that it can afford to pay the interest. Coca-Cola has net debt of 2.76 times its EBITDA. Using debt can accelerate business growth, but also increases the risks.
We calculated its interest cover by measuring its earnings before interest and tax (EBIT), and dividing this by the company's net interest expense. Coca-Cola has interest cover of more than 12 times its interest expense, which we think is quite strong.
We update our data on Coca-Cola every 24 hours, so you can always get our latest analysis of its financial health, here.
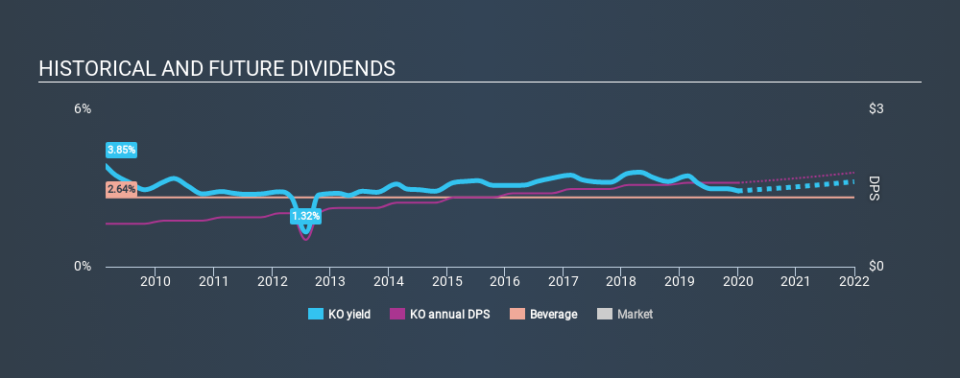
Dividend Volatility
Before buying a stock for its income, we want to see if the dividends have been stable in the past, and if the company has a track record of maintaining its dividend. For the purpose of this article, we only scrutinise the last decade of Coca-Cola's dividend payments. Its dividend payments have fallen by 20% or more on at least one occasion over the past ten years. During the past ten-year period, the first annual payment was US$0.82 in 2010, compared to US$1.60 last year. This works out to be a compound annual growth rate (CAGR) of approximately 6.9% a year over that time. The growth in dividends has not been linear, but the CAGR is a decent approximation of the rate of change over this time frame.
Dividend Growth Potential
Given that the dividend has been cut in the past, we need to check if earnings are growing and if that might lead to stronger dividends in the future. While there may be fluctuations in the past , Coca-Cola's earnings per share have basically not grown from where they were five years ago. Over the long term, steady earnings per share is a risk as the value of the dividends can be reduced by inflation.
Conclusion
When we look at a dividend stock, we need to form a judgement on whether the dividend will grow, if the company is able to maintain it in a wide range of economic circumstances, and if the dividend payout is sustainable. First, we think Coca-Cola is paying out an acceptable percentage of its cashflow and profit. Earnings per share have been falling, and the company has cut its dividend at least once in the past. From a dividend perspective, this is a cause for concern. Overall, Coca-Cola falls short in several key areas here. Unless the investor has strong grounds for an alternative conclusion, we find it hard to get interested in a dividend stock with these characteristics.
Without at least some growth in earnings per share over time, the dividend will eventually come under pressure either from costs or inflation. See if the 18 analysts are forecasting a turnaround in our free collection of analyst estimates here.
We have also put together a list of global stocks with a market capitalisation above $1bn and yielding more 3%.
If you spot an error that warrants correction, please contact the editor at editorial-team@simplywallst.com. This article by Simply Wall St is general in nature. It does not constitute a recommendation to buy or sell any stock, and does not take account of your objectives, or your financial situation. Simply Wall St has no position in the stocks mentioned.
We aim to bring you long-term focused research analysis driven by fundamental data. Note that our analysis may not factor in the latest price-sensitive company announcements or qualitative material. Thank you for reading.
