
 Yahoo Finance
 Is Coca-Cola HBC AG (LON:CCH) Creating Value For Shareholders?

Want to participate in a short research study? Help shape the future of investing tools and receive a $20 prize!
Today we’ll look at Coca-Cola HBC AG (LON:CCH) and reflect on its potential as an investment. To be precise, we’ll consider its Return On Capital Employed (ROCE), as that will inform our view of the quality of the business.
Firstly, we’ll go over how we calculate ROCE. Then we’ll compare its ROCE to similar companies. Last but not least, we’ll look at what impact its current liabilities have on its ROCE.
Understanding Return On Capital Employed (ROCE)
ROCE measures the ‘return’ (pre-tax profit) a company generates from capital employed in its business. Generally speaking a higher ROCE is better. Overall, it is a valuable metric that has its flaws. Author Edwin Whiting says to be careful when comparing the ROCE of different businesses, since ‘No two businesses are exactly alike.’
How Do You Calculate Return On Capital Employed?
The formula for calculating the return on capital employed is:
Return on Capital Employed = Earnings Before Interest and Tax (EBIT) ÷ (Total Assets – Current Liabilities)
Or for Coca-Cola HBC:
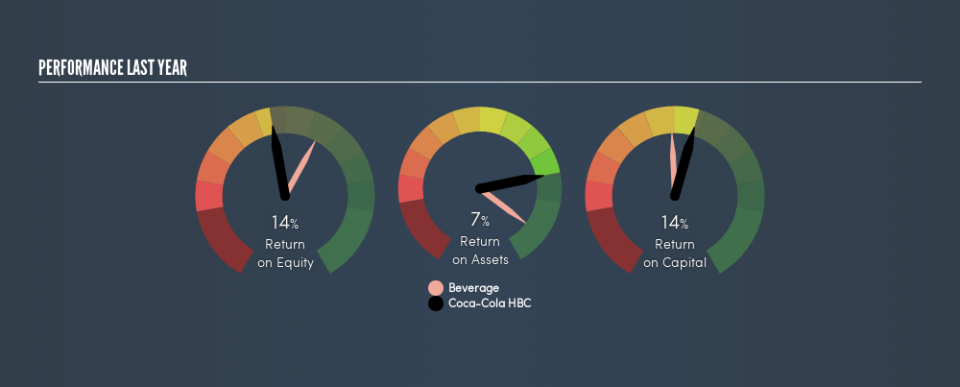
0.14 = €672m ÷ (€6.9b – €2.0b) (Based on the trailing twelve months to December 2018.)
Therefore, Coca-Cola HBC has an ROCE of 14%.
Check out our latest analysis for Coca-Cola HBC
Does Coca-Cola HBC Have A Good ROCE?
ROCE is commonly used for comparing the performance of similar businesses. It appears that Coca-Cola HBC’s ROCE is fairly close to the Beverage industry average of 15%. Regardless of where Coca-Cola HBC sits next to its industry, its ROCE in absolute terms appears satisfactory, and this company could be worth a closer look.
When considering this metric, keep in mind that it is backwards looking, and not necessarily predictive. ROCE can be misleading for companies in cyclical industries, with returns looking impressive during the boom times, but very weak during the busts. ROCE is, after all, simply a snap shot of a single year. Future performance is what matters, and you can see analyst predictions in our free report on analyst forecasts for the company.
How Coca-Cola HBC’s Current Liabilities Impact Its ROCE
Short term (or current) liabilities, are things like supplier invoices, overdrafts, or tax bills that need to be paid within 12 months. Due to the way ROCE is calculated, a high level of current liabilities makes a company look as though it has less capital employed, and thus can (sometimes unfairly) boost the ROCE. To counter this, investors can check if a company has high current liabilities relative to total assets.
Coca-Cola HBC has total assets of €6.9b and current liabilities of €2.0b. As a result, its current liabilities are equal to approximately 29% of its total assets. A fairly low level of current liabilities is not influencing the ROCE too much.
Our Take On Coca-Cola HBC’s ROCE
With that in mind, Coca-Cola HBC’s ROCE appears pretty good. Of course you might be able to find a better stock than Coca-Cola HBC. So you may wish to see this free collection of other companies that have grown earnings strongly.
For those who like to find winning investments this free list of growing companies with recent insider purchasing, could be just the ticket.
We aim to bring you long-term focused research analysis driven by fundamental data. Note that our analysis may not factor in the latest price-sensitive company announcements or qualitative material.
If you spot an error that warrants correction, please contact the editor at editorial-team@simplywallst.com. This article by Simply Wall St is general in nature. It does not constitute a recommendation to buy or sell any stock, and does not take account of your objectives, or your financial situation. Simply Wall St has no position in the stocks mentioned. On rare occasion, data errors may occur. Thank you for reading.
