
 Yahoo Finance
 Was The Colonial Motor Company Limited’s (NZSE:CMO) Earnings Growth Better Than The Industry’s?

Assessing The Colonial Motor Company Limited’s (NZSE:CMO) past track record of performance is a valuable exercise for investors. It enables us to reflect on whether the company has met or exceed expectations, which is a great indicator for future performance. Today I will assess CMO’s recent performance announced on 31 December 2017 and evaluate these figures to its longer term trend and industry movements. See our latest analysis for Colonial Motor
How CMO fared against its long-term earnings performance and its industry
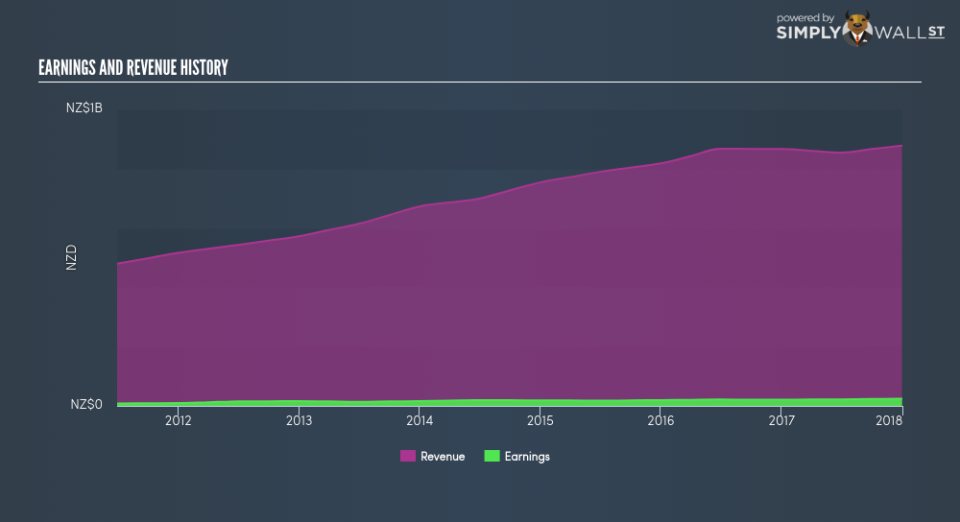
CMO’s trailing twelve-month earnings (from 31 December 2017) of NZ$24.20m has jumped 15.58% compared to the previous year. Furthermore, this one-year growth rate has exceeded its 5-year annual growth average of 11.52%, indicating the rate at which CMO is growing has accelerated. What’s the driver of this growth? Let’s see whether it is solely due to an industry uplift, or if Colonial Motor has seen some company-specific growth.
Over the last couple of years, Colonial Motor increased its bottom line faster than revenue by successfully controlling its costs. This resulted in a margin expansion and profitability over time. Eyeballing growth from a sector-level, the NZ specialty retail industry has been growing its average earnings by double-digit 16.86% in the past year, and a flatter 1.41% over the past five years. This means that whatever uplift the industry is enjoying, Colonial Motor has not been able to leverage it as much as its average peer.
In terms of returns from investment, Colonial Motor has not invested its equity funds well, leading to a 13.91% return on equity (ROE), below the sensible minimum of 20%. Furthermore, its return on assets (ROA) of 8.50% is below the NZ Specialty Retail industry of 8.98%, indicating Colonial Motor’s are utilized less efficiently. However, its return on capital (ROC), which also accounts for Colonial Motor’s debt level, has increased over the past 3 years from 17.12% to 17.85%.
What does this mean?
Though Colonial Motor’s past data is helpful, it is only one aspect of my investment thesis. While Colonial Motor has a good historical track record with positive growth and profitability, there’s no certainty that this will extrapolate into the future. You should continue to research Colonial Motor to get a more holistic view of the stock by looking at:
Future Outlook: What are well-informed industry analysts predicting for CMO’s future growth? Take a look at our free research report of analyst consensus for CMO’s outlook.
Financial Health: Is CMO’s operations financially sustainable? Balance sheets can be hard to analyze, which is why we’ve done it for you. Check out our financial health checks here.
Other High-Performing Stocks: Are there other stocks that provide better prospects with proven track records? Explore our free list of these great stocks here.
NB: Figures in this article are calculated using data from the trailing twelve months from 31 December 2017. This may not be consistent with full year annual report figures.
To help readers see pass the short term volatility of the financial market, we aim to bring you a long-term focused research analysis purely driven by fundamental data. Note that our analysis does not factor in the latest price sensitive company announcements.
The author is an independent contributor and at the time of publication had no position in the stocks mentioned.
