
 Yahoo Finance
 Companies Like NeuroMetrix (NASDAQ:NURO) Are In A Position To Invest In Growth
There's no doubt that money can be made by owning shares of unprofitable businesses. For example, although Amazon.com made losses for many years after listing, if you had bought and held the shares since 1999, you would have made a fortune. But while history lauds those rare successes, those that fail are often forgotten; who remembers Pets.com?
Given this risk, we thought we'd take a look at whether NeuroMetrix (NASDAQ:NURO) shareholders should be worried about its cash burn. For the purpose of this article, we'll define cash burn as the amount of cash the company is spending each year to fund its growth (also called its negative free cash flow). First, we'll determine its cash runway by comparing its cash burn with its cash reserves.
Check out our latest analysis for NeuroMetrix
Does NeuroMetrix Have A Long Cash Runway?
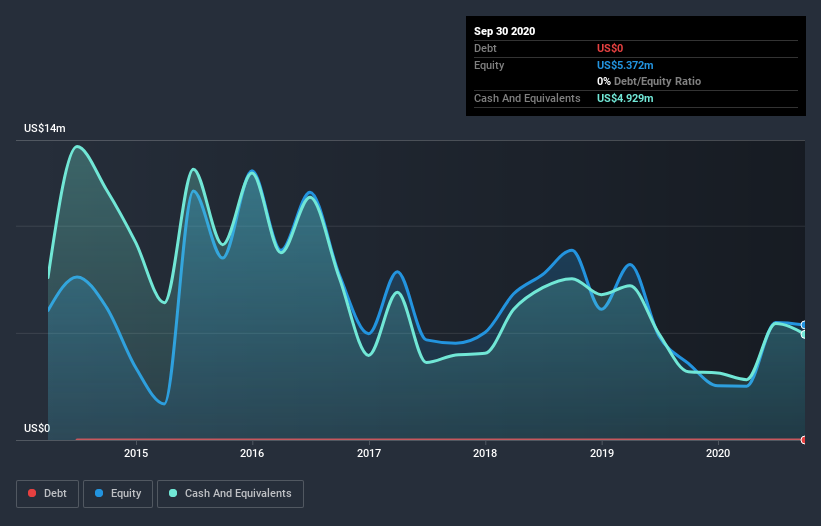
A company's cash runway is calculated by dividing its cash hoard by its cash burn. When NeuroMetrix last reported its balance sheet in September 2020, it had zero debt and cash worth US$4.9m. In the last year, its cash burn was US$2.4m. So it had a cash runway of about 2.0 years from September 2020. That's decent, giving the company a couple years to develop its business. Depicted below, you can see how its cash holdings have changed over time.
How Well Is NeuroMetrix Growing?
It was fairly positive to see that NeuroMetrix reduced its cash burn by 44% during the last year. Unfortunately, however, operating revenue declined by 36% during the period. In light of the data above, we're fairly sanguine about the business growth trajectory. Of course, we've only taken a quick look at the stock's growth metrics, here. This graph of historic earnings and revenue shows how NeuroMetrix is building its business over time.
How Hard Would It Be For NeuroMetrix To Raise More Cash For Growth?
While NeuroMetrix seems to be in a fairly good position, it's still worth considering how easily it could raise more cash, even just to fuel faster growth. Issuing new shares, or taking on debt, are the most common ways for a listed company to raise more money for its business. Commonly, a business will sell new shares in itself to raise cash and drive growth. We can compare a company's cash burn to its market capitalisation to get a sense for how many new shares a company would have to issue to fund one year's operations.
NeuroMetrix's cash burn of US$2.4m is about 12% of its US$20m market capitalisation. As a result, we'd venture that the company could raise more cash for growth without much trouble, albeit at the cost of some dilution.
How Risky Is NeuroMetrix's Cash Burn Situation?
Even though its falling revenue makes us a little nervous, we are compelled to mention that we thought NeuroMetrix's cash burn reduction was relatively promising. Cash burning companies are always on the riskier side of things, but after considering all of the factors discussed in this short piece, we're not too worried about its rate of cash burn. Taking a deeper dive, we've spotted 3 warning signs for NeuroMetrix you should be aware of, and 1 of them makes us a bit uncomfortable.
Of course, you might find a fantastic investment by looking elsewhere. So take a peek at this free list of companies insiders are buying, and this list of stocks growth stocks (according to analyst forecasts)
This article by Simply Wall St is general in nature. It does not constitute a recommendation to buy or sell any stock, and does not take account of your objectives, or your financial situation. We aim to bring you long-term focused analysis driven by fundamental data. Note that our analysis may not factor in the latest price-sensitive company announcements or qualitative material. Simply Wall St has no position in any stocks mentioned.
Have feedback on this article? Concerned about the content? Get in touch with us directly. Alternatively, email editorial-team (at) simplywallst.com.
