
 Yahoo Finance
 Companies Like TruScreen Group (NZSE:TRU) Are In A Position To Invest In Growth
We can readily understand why investors are attracted to unprofitable companies. For example, biotech and mining exploration companies often lose money for years before finding success with a new treatment or mineral discovery. But while history lauds those rare successes, those that fail are often forgotten; who remembers Pets.com?
So should TruScreen Group (NZSE:TRU) shareholders be worried about its cash burn? In this report, we will consider the company's annual negative free cash flow, henceforth referring to it as the 'cash burn'. Let's start with an examination of the business' cash, relative to its cash burn.
View our latest analysis for TruScreen Group
Does TruScreen Group Have A Long Cash Runway?
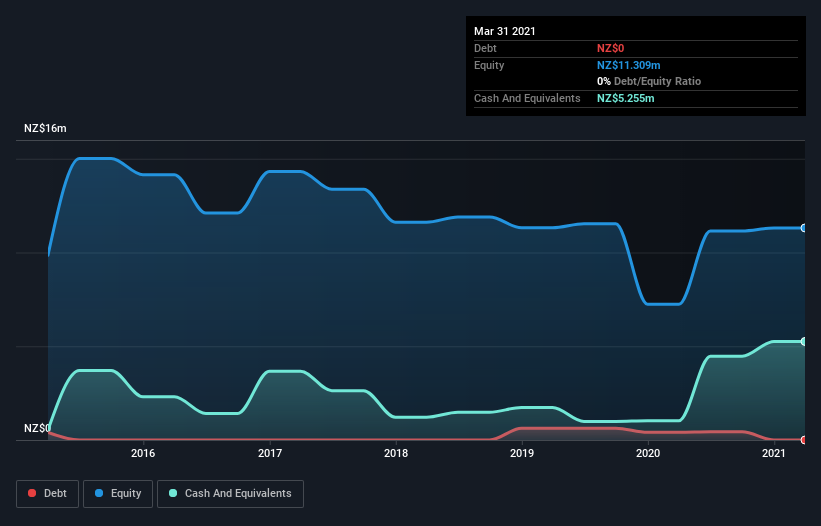
A company's cash runway is the amount of time it would take to burn through its cash reserves at its current cash burn rate. When TruScreen Group last reported its balance sheet in March 2021, it had zero debt and cash worth NZ$5.3m. Importantly, its cash burn was NZ$2.3m over the trailing twelve months. So it had a cash runway of about 2.3 years from March 2021. Arguably, that's a prudent and sensible length of runway to have. The image below shows how its cash balance has been changing over the last few years.
How Is TruScreen Group's Cash Burn Changing Over Time?
Although TruScreen Group had revenue of NZ$2.0m in the last twelve months, its operating revenue was only NZ$1.1m in that time period. We don't think that's enough operating revenue for us to understand too much from revenue growth rates, since the company is growing off a low base. So we'll focus on the cash burn, today. Over the last year its cash burn actually increased by 40%, which suggests that management are increasing investment in future growth, but not too quickly. That's not necessarily a bad thing, but investors should be mindful of the fact that will shorten the cash runway. While the past is always worth studying, it is the future that matters most of all. So you might want to take a peek at how much the company is expected to grow in the next few years.
How Easily Can TruScreen Group Raise Cash?
Given its cash burn trajectory, TruScreen Group shareholders may wish to consider how easily it could raise more cash, despite its solid cash runway. Issuing new shares, or taking on debt, are the most common ways for a listed company to raise more money for its business. Many companies end up issuing new shares to fund future growth. By looking at a company's cash burn relative to its market capitalisation, we gain insight on how much shareholders would be diluted if the company needed to raise enough cash to cover another year's cash burn.
TruScreen Group has a market capitalisation of NZ$28m and burnt through NZ$2.3m last year, which is 8.2% of the company's market value. Given that is a rather small percentage, it would probably be really easy for the company to fund another year's growth by issuing some new shares to investors, or even by taking out a loan.
So, Should We Worry About TruScreen Group's Cash Burn?
On this analysis of TruScreen Group's cash burn, we think its cash runway was reassuring, while its increasing cash burn has us a bit worried. Considering all the factors discussed in this article, we're not overly concerned about the company's cash burn, although we do think shareholders should keep an eye on how it develops. Taking an in-depth view of risks, we've identified 4 warning signs for TruScreen Group that you should be aware of before investing.
If you would prefer to check out another company with better fundamentals, then do not miss this free list of interesting companies, that have HIGH return on equity and low debt or this list of stocks which are all forecast to grow.
This article by Simply Wall St is general in nature. It does not constitute a recommendation to buy or sell any stock, and does not take account of your objectives, or your financial situation. We aim to bring you long-term focused analysis driven by fundamental data. Note that our analysis may not factor in the latest price-sensitive company announcements or qualitative material. Simply Wall St has no position in any stocks mentioned.
Have feedback on this article? Concerned about the content? Get in touch with us directly. Alternatively, email editorial-team (at) simplywallst.com.
