
 Yahoo Finance
 Compumedics (ASX:CMP) Will Be Hoping To Turn Its Returns On Capital Around
If we want to find a stock that could multiply over the long term, what are the underlying trends we should look for? Amongst other things, we'll want to see two things; firstly, a growing return on capital employed (ROCE) and secondly, an expansion in the company's amount of capital employed. Ultimately, this demonstrates that it's a business that is reinvesting profits at increasing rates of return. Having said that, from a first glance at Compumedics (ASX:CMP) we aren't jumping out of our chairs at how returns are trending, but let's have a deeper look.
What is Return On Capital Employed (ROCE)?
Just to clarify if you're unsure, ROCE is a metric for evaluating how much pre-tax income (in percentage terms) a company earns on the capital invested in its business. To calculate this metric for Compumedics, this is the formula:
Return on Capital Employed = Earnings Before Interest and Tax (EBIT) ÷ (Total Assets - Current Liabilities)
0.082 = AU$1.9m ÷ (AU$39m - AU$15m) (Based on the trailing twelve months to June 2021).
Therefore, Compumedics has an ROCE of 8.2%. Ultimately, that's a low return and it under-performs the Medical Equipment industry average of 15%.
See our latest analysis for Compumedics
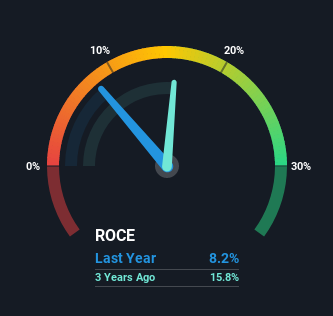
Historical performance is a great place to start when researching a stock so above you can see the gauge for Compumedics' ROCE against it's prior returns. If you'd like to look at how Compumedics has performed in the past in other metrics, you can view this free graph of past earnings, revenue and cash flow.
What Does the ROCE Trend For Compumedics Tell Us?
When we looked at the ROCE trend at Compumedics, we didn't gain much confidence. Over the last five years, returns on capital have decreased to 8.2% from 21% five years ago. Meanwhile, the business is utilizing more capital but this hasn't moved the needle much in terms of sales in the past 12 months, so this could reflect longer term investments. It may take some time before the company starts to see any change in earnings from these investments.
The Bottom Line
Bringing it all together, while we're somewhat encouraged by Compumedics' reinvestment in its own business, we're aware that returns are shrinking. Since the stock has declined 29% over the last five years, investors may not be too optimistic on this trend improving either. On the whole, we aren't too inspired by the underlying trends and we think there may be better chances of finding a multi-bagger elsewhere.
If you want to know some of the risks facing Compumedics we've found 2 warning signs (1 is significant!) that you should be aware of before investing here.
While Compumedics isn't earning the highest return, check out this free list of companies that are earning high returns on equity with solid balance sheets.
This article by Simply Wall St is general in nature. We provide commentary based on historical data and analyst forecasts only using an unbiased methodology and our articles are not intended to be financial advice. It does not constitute a recommendation to buy or sell any stock, and does not take account of your objectives, or your financial situation. We aim to bring you long-term focused analysis driven by fundamental data. Note that our analysis may not factor in the latest price-sensitive company announcements or qualitative material. Simply Wall St has no position in any stocks mentioned.
Have feedback on this article? Concerned about the content? Get in touch with us directly. Alternatively, email editorial-team (at) simplywallst.com.
