
 Yahoo Finance
 Should You Be Concerned About Sabre Corporation’s (NASDAQ:SABR) Earnings Growth?

When Sabre Corporation (NASDAQ:SABR) released its most recent earnings update (30 June 2018), I wanted to understand how these figures stacked up against its past performance. The two benchmarks I used were Sabre’s average earnings over the past couple of years, and its industry performance. These are useful yardsticks to help me gauge whether or not SABR actually performed well. Below is a quick commentary on how I see SABR has performed.
View our latest analysis for Sabre
Were SABR’s earnings stronger than its past performances and the industry?
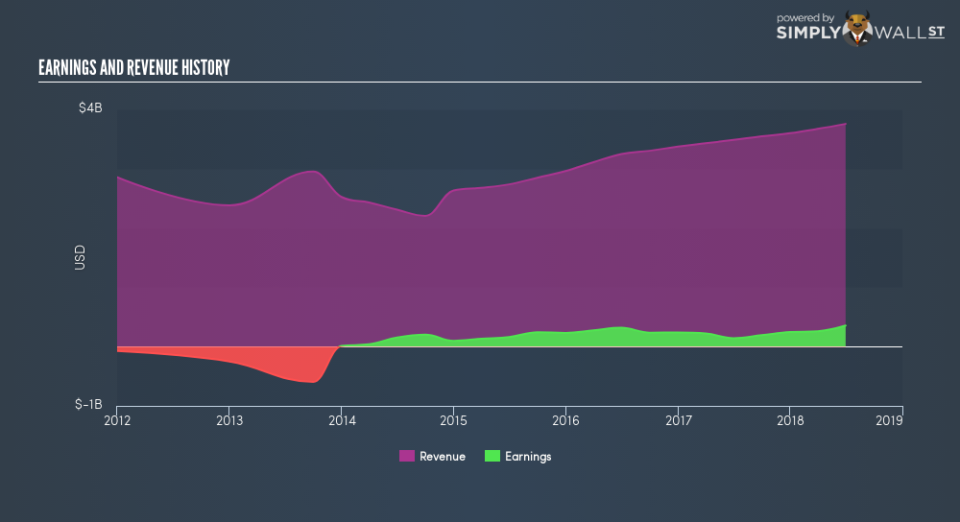
SABR’s trailing twelve-month earnings (from 30 June 2018) of US$353.9m has more than doubled from US$237.0m in the prior year. Furthermore, this one-year growth rate has exceeded its 5-year annual growth average of 39.1%, indicating the rate at which SABR is growing has accelerated. What’s enabled this growth? Let’s see if it is merely a result of industry tailwinds, or if Sabre has seen some company-specific growth.
Over the past couple of years, Sabre increased its bottom line faster than revenue by efficiently controlling its costs. This has caused a margin expansion and profitability over time. Viewing growth from a sector-level, the US it industry has been growing its average earnings by double-digit 23.3% in the previous twelve months, and a more muted 9.3% over the last five years. This growth is a median of profitable companies of 25 IT companies in US including Value Exchange International, Sykes Enterprises and ALJ Regional Holdings. This means that whatever tailwind the industry is benefiting from, Sabre is capable of amplifying this to its advantage.
In terms of returns from investment, Sabre has invested its equity funds well leading to a 40.7% return on equity (ROE), above the sensible minimum of 20%. Furthermore, its return on assets (ROA) of 8.8% exceeds the US IT industry of 7.3%, indicating Sabre has used its assets more efficiently. And finally, its return on capital (ROC), which also accounts for Sabre’s debt level, has increased over the past 3 years from 6.7% to 9.7%.
What does this mean?
While past data is useful, it doesn’t tell the whole story. While Sabre has a good historical track record with positive growth and profitability, there’s no certainty that this will extrapolate into the future. You should continue to research Sabre to get a better picture of the stock by looking at:
Future Outlook: What are well-informed industry analysts predicting for SABR’s future growth? Take a look at our free research report of analyst consensus for SABR’s outlook.
Financial Health: Are SABR’s operations financially sustainable? Balance sheets can be hard to analyze, which is why we’ve done it for you. Check out our financial health checks here.
Other High-Performing Stocks: Are there other stocks that provide better prospects with proven track records? Explore our free list of these great stocks here.
NB: Figures in this article are calculated using data from the trailing twelve months from 30 June 2018. This may not be consistent with full year annual report figures.
To help readers see past the short term volatility of the financial market, we aim to bring you a long-term focused research analysis purely driven by fundamental data. Note that our analysis does not factor in the latest price-sensitive company announcements.
The author is an independent contributor and at the time of publication had no position in the stocks mentioned. For errors that warrant correction please contact the editor at editorial-team@simplywallst.com.
