
 Yahoo Finance
 Have You Considered These Key Risks For US Bancorp (NYSE:USB)?

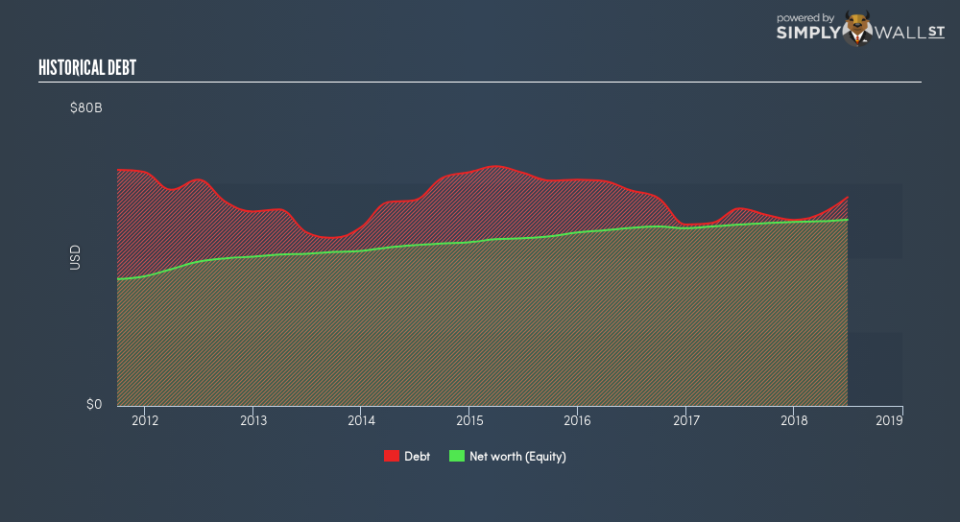
Improving credit quality as a result of post-recession recovery has led to a strong growth environment for financial institutions. Large banks such as US Bancorp (NYSE:USB), with a market capitalisation of US$87.68b, have benefited from this momentum. Growth stimulates demand for loans and impacts a borrower’s ability to repay which directly affects the level of risk U.S. Bancorp takes on. With stricter regulations as a consequence of the recession, banks are more conservative in their lending practices, leading to more prudent levels of risky assets on the balance sheet. The level of risky assets a bank holds on its accounts affects the attractiveness of the company as an investment. So today we will focus on three important metrics that are insightful proxies for risk.
View our latest analysis for U.S. Bancorp
How Much Risk Is Too Much?
U.S. Bancorp is engaging in risking lending practices if it is over-exposed to bad debt. Generally, loans that are “bad” and cannot be recovered by the bank should make up less than 3% of its total loans. Bad debt is written off when loans are not repaid. This is classified as an expense which directly impacts U.S. Bancorp’s bottom line. The bank’s bad debt only makes up a very small 0.33% to total debt which means means the bank has very strict bad debt management and faces insignificant levels of default.
How Good Is U.S. Bancorp At Forecasting Its Risks?
U.S. Bancorp’s forecasting and provisioning accuracy for its bad loans indicates it has a strong understanding of its own risk levels. If the level of provisioning covers 100% or more of the actual bad debt expense the bank writes off, then it is relatively accurate and prudent in its bad debt provisioning. With a bad loan to bad debt ratio of 429.82%, the bank has extremely over-provisioned by 329.82% compared to the industry-average, which illustrates perhaps a too cautious approach to forecasting bad debt.
How Big Is U.S. Bancorp’s Safety Net?
U.S. Bancorp profits from lending out its various forms of borrowings and charging interest rates. Deposits from customers tend to carry the lowest risk due to the relatively stable interest rate and amount available. As a rule, a bank is considered less risky if it holds a higher level of deposits. Since U.S. Bancorp’s total deposit to total liabilities is very high at 82.73% which is well-above the prudent level of 50% for banks, U.S. Bancorp may be too cautious with its level of deposits and has plenty of headroom to take on risker forms of liability.
Next Steps:
How will USB’s recent acquisition impact the business going forward? Should you be concerned about the future of USB and the sustainability of its financial health? I’ve bookmarked USB’s company page on Simply Wall St to stay informed with changes in outlook and valuation. This is also the source of data for this article. The three main sections I’d recommend you check out are:
Future Outlook: What are well-informed industry analysts predicting for USB’s future growth? Take a look at our free research report of analyst consensus for USB’s outlook.
Valuation: What is USB worth today? Has the future growth potential already been factored into the price? The intrinsic value infographic in our free research report helps visualize whether USB is currently mispriced by the market.
Other High-Performing Stocks: Are there other stocks that provide better prospects with proven track records? Explore our free list of these great stocks here.
To help readers see past the short term volatility of the financial market, we aim to bring you a long-term focused research analysis purely driven by fundamental data. Note that our analysis does not factor in the latest price-sensitive company announcements.
The author is an independent contributor and at the time of publication had no position in the stocks mentioned. For errors that warrant correction please contact the editor at editorial-team@simplywallst.com.
