
 Yahoo Finance
 In Consolidation Mode, Bitcoin Awaits Decisive Move
Bitcoin has been restricted to a narrow price range of $10,000 to $11,000 for almost 72 hours.
CoinDesk's Bitcoin Price Index (BPI) moved above the $10,000 mark on Monday, but the rally from last Sunday's low of $9,304.68 ceased at a seven-day high of $11,044.16 yesterday. At the time of writing, the BPI is at $11,583.
The cryptocurrency has depreciated by 1.4 percent in the last 24 hours, according to data from CoinMarketCap. Further, it ended last month on a flat note, and is reporting a 1 percent gain on a weekly basis.
Notably, average daily trading volume dropped 38 percent in February, adding credence to bitcoin developer Meni Rosenfeld's view that the craze for buying cryptocurrencies, in general, has calmed down.
That said, trading activity could pick up if the pace of bitcoin (BTC) sees an inverse head-and-shoulders breakout. However, technical charts also indicate scope for a big sell-off if BTC dips below the lows seen over the weekend.
Bullish scenario: inverse head-and-shoulders breakout
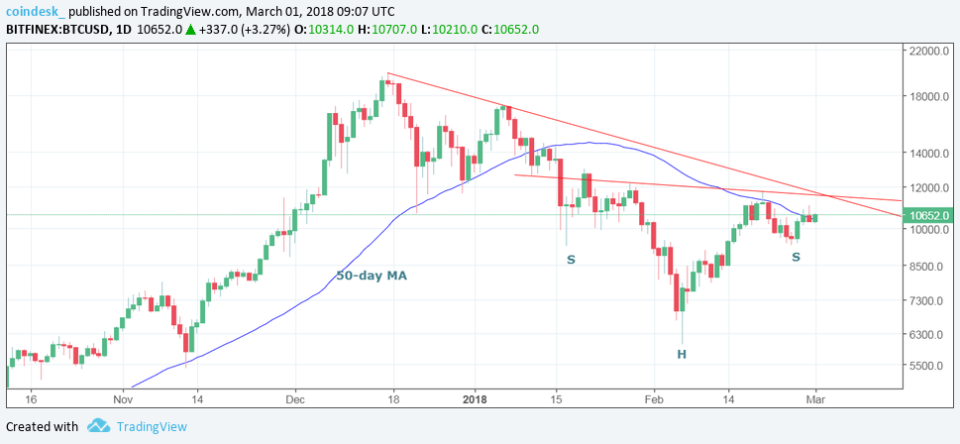
The descending trendline resistance and the inverse head-and-shoulders neckline are shown to converge at $11,640 by Saturday.
A high volume break (UTC lose) above $11,640 would signal long-term bull market revival and could open up towards $17,000-$17,400.
Bearish scenario I: BTC drops below $9,280

BTC could drop to point D ($6,659), as indicated by the bat pattern (harmonic pattern), if yesterday's inverted bearish hammer candle on the downward sloping 50-day moving average is followed by a break below $9,324.75 (Feb. 25 low), today or in the next few days.
As per rules, the leg BC could go as high as $11,502 - 88.6 percent Fibonacci retracement of leg AB. Only a move above $11,502 would invalidate the bat pattern.
Note that point D is a "bullish reversal" according to bat pattern rules, meaning BTC will likely witness a sharp rebound from $6,659.
Bearish scenario II
Another possibility is that BTC moves above $11,502, but faces rejection at the confluence of inverse head-and-shoulders neckline resistance and descending trendline resistance
Failure to take out the confluence of resistance at $11,640, followed by a quick drop below $9280.4, could yield a sell-off to $6,000 (February low).
Hour glass image via Shutterstock
