
 Yahoo Finance
 Is Contact Energy Limited’s (NZSE:CEN) Return On Capital Employed Any Good?

Today we'll evaluate Contact Energy Limited (NZSE:CEN) to determine whether it could have potential as an investment idea. Specifically, we're going to calculate its Return On Capital Employed (ROCE), in the hopes of getting some insight into the business.
First of all, we'll work out how to calculate ROCE. Then we'll compare its ROCE to similar companies. Finally, we'll look at how its current liabilities affect its ROCE.
Return On Capital Employed (ROCE): What is it?
ROCE is a measure of a company's yearly pre-tax profit (its return), relative to the capital employed in the business. In general, businesses with a higher ROCE are usually better quality. Ultimately, it is a useful but imperfect metric. Renowned investment researcher Michael Mauboussin has suggested that a high ROCE can indicate that 'one dollar invested in the company generates value of more than one dollar'.
How Do You Calculate Return On Capital Employed?
The formula for calculating the return on capital employed is:
Return on Capital Employed = Earnings Before Interest and Tax (EBIT) ÷ (Total Assets - Current Liabilities)
Or for Contact Energy:
0.066 = NZ$300m ÷ (NZ$5.0b - NZ$394m) (Based on the trailing twelve months to June 2019.)
So, Contact Energy has an ROCE of 6.6%.
See our latest analysis for Contact Energy
Does Contact Energy Have A Good ROCE?
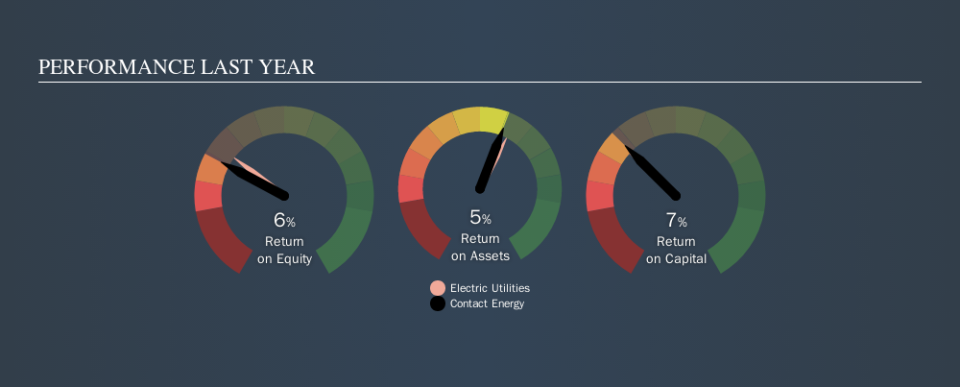
ROCE can be useful when making comparisons, such as between similar companies. Using our data, Contact Energy's ROCE appears to be around the 6.4% average of the Electric Utilities industry. Setting aside the industry comparison for now, Contact Energy's ROCE is mediocre in absolute terms, considering the risk of investing in stocks versus the safety of a bank account. It is possible that there are more rewarding investments out there.
You can click on the image below to see (in greater detail) how Contact Energy's past growth compares to other companies.
When considering this metric, keep in mind that it is backwards looking, and not necessarily predictive. Companies in cyclical industries can be difficult to understand using ROCE, as returns typically look high during boom times, and low during busts. This is because ROCE only looks at one year, instead of considering returns across a whole cycle. Since the future is so important for investors, you should check out our free report on analyst forecasts for Contact Energy.
How Contact Energy's Current Liabilities Impact Its ROCE
Current liabilities are short term bills and invoices that need to be paid in 12 months or less. Due to the way ROCE is calculated, a high level of current liabilities makes a company look as though it has less capital employed, and thus can (sometimes unfairly) boost the ROCE. To counteract this, we check if a company has high current liabilities, relative to its total assets.
Contact Energy has total assets of NZ$5.0b and current liabilities of NZ$394m. Therefore its current liabilities are equivalent to approximately 8.0% of its total assets. Contact Energy reports few current liabilities, which have a negligible impact on its unremarkable ROCE.
What We Can Learn From Contact Energy's ROCE
Based on this information, Contact Energy appears to be a mediocre business. Of course, you might also be able to find a better stock than Contact Energy. So you may wish to see this free collection of other companies that have grown earnings strongly.
If you are like me, then you will not want to miss this free list of growing companies that insiders are buying.
We aim to bring you long-term focused research analysis driven by fundamental data. Note that our analysis may not factor in the latest price-sensitive company announcements or qualitative material.
If you spot an error that warrants correction, please contact the editor at editorial-team@simplywallst.com. This article by Simply Wall St is general in nature. It does not constitute a recommendation to buy or sell any stock, and does not take account of your objectives, or your financial situation. Simply Wall St has no position in the stocks mentioned. Thank you for reading.
